
IMFSurvey Magazine: What the numbers show

The value of household financial assets has deteriorated in many advanced economies (photo: Alexis Glenn/UPI)
World Economic Outlook
Households Hit Hard by Wealth Losses
By Petya Koeva Brooks
IMF Research Department
June 24, 2009
- Global financial crisis erodes household wealth in advanced countries
- Increasing balance sheets implied higher vulnerability to equity and house price shocks
- Recent wealth losses have depressed consumption and contributed to rise in savings rate
The financial crisis has erased a considerable amount of household wealth in many advanced economies. The precipitous fall in asset prices—across equity, bond, and housing markets—has eroded the value of financial and housing assets and the net worth of households, according to IMF research.
During the first three quarters of 2008 alone, the value of household financial assets decreased by about 8 percent in the United States and the United Kingdom, by close to 6 percent in the euro area, and by 5 percent in Japan. As global equity markets plunged in the last quarter of 2008, household financial wealth declined further—for example, by an additional 10 percent in the United States. At the same time, the value of housing assets also deteriorated in line with falling house prices, especially in the United States and the United Kingdom.
Starting position
In advanced economies, households faced the financial crisis with higher net worth—defined as total assets (housing and financial) minus financial liabilities—but also with more vulnerable, leveraged balance sheets. Household net worth rose substantially in the four largest advanced economies during 2002–06 (see Chart 1). On the asset side, in tandem with asset prices, gross financial and household wealth (as a percent of disposable income) increased by more than 100 percent in the United States, euro area, and the United Kingdom.

The increased size of household assets, coupled with their composition, implied higher overall vulnerability to equity and house price shocks, with notable differences across countries. The broad composition of assets reveals that gross household wealth is more dependent on housing assets in the United Kingdom and euro area and on financial assets in the United States and Japan.
As far as the composition of financial assets is concerned, most notable is the large share of deposits held by Japanese households. Taken together, these observations suggest that in relative terms, U.S. households were more vulnerable to equity price shocks and U.K. and euro area households to house price shocks.
Households generally became more indebted (see Chart 2). In the advanced economies other than Japan, financial liabilities rose—as a percent of disposable income, net financial assets, net worth, and household deposits.
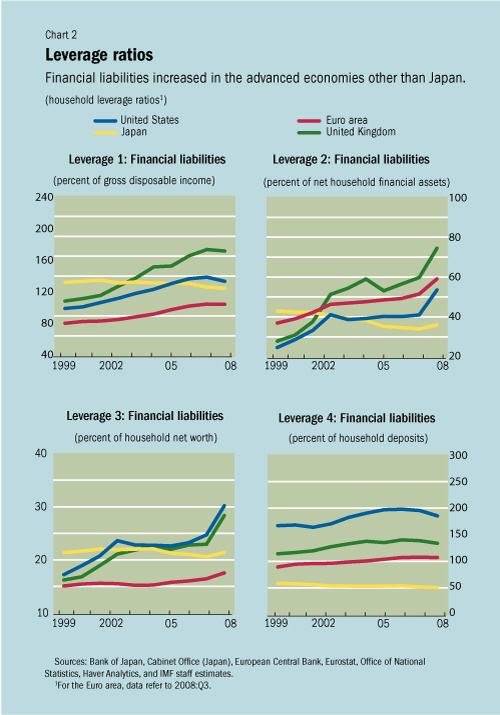
But the leverage ratios also indicate substantial differences across countries. For instance, although household financial liabilities relative to net worth remained broadly unchanged in Japan and rose moderately in the euro area, they increased substantially in the United Kingdom and the United States—from about 17 percent of net worth in 1999 to more than 28 percent at end-2008.
Impact on economic activity
Although its exact contribution is hard to assess, the recent destruction of wealth is likely to contribute to a rise in the household saving rate and weakness in consumption in advanced economies, especially in the United States and the United Kingdom, where the decline in net worth has been the largest so far.
For instance, the losses in household wealth during 2008 were about $11 trillion in the United States ($8.5 trillion in financial assets and $2.5 trillion in housing assets) and were estimated at $1.5 trillion in the United Kingdom ($0.6 trillion in financial assets and $0.9 trillion in housing assets). The long-run impact on the saving rate of these losses could be in the range of 2½–9 percentage points in the United States and 3¼–11¼ percentage points in the United Kingdom, depending on the assumed marginal propensity to consume.
Comments on this article should be sent to imfsurvey@imf.org