(Versión en español)
Today’s Pop Quiz: What do Oregon and New Mexico have in common? What could possibly link the spectacular vistas of Crater Lake to the glistening White Sands?
Answer: One link is these two states have the highest share of computer and electronic production in the entire United States. Think Intel in the Silicon Forest or Los Alamos. They also rank similarly in information technology usage by their businesses.
Despite this advantage in cutting edge science, in recent work we show these two states at polar ends in terms of productivity performance over the past decades. Businesses in these two states have had a very different experience in translating their passion for tech into productivity. To illustrate, between 2005 and 2010, a $100 investment in capital and labor in Oregon would have yielded a $25 payback, while a similar investment in New Mexico would have paid only $5.
How can this be possible? Before answering that question, let’s quickly review the facts.
The U.S. productivity story
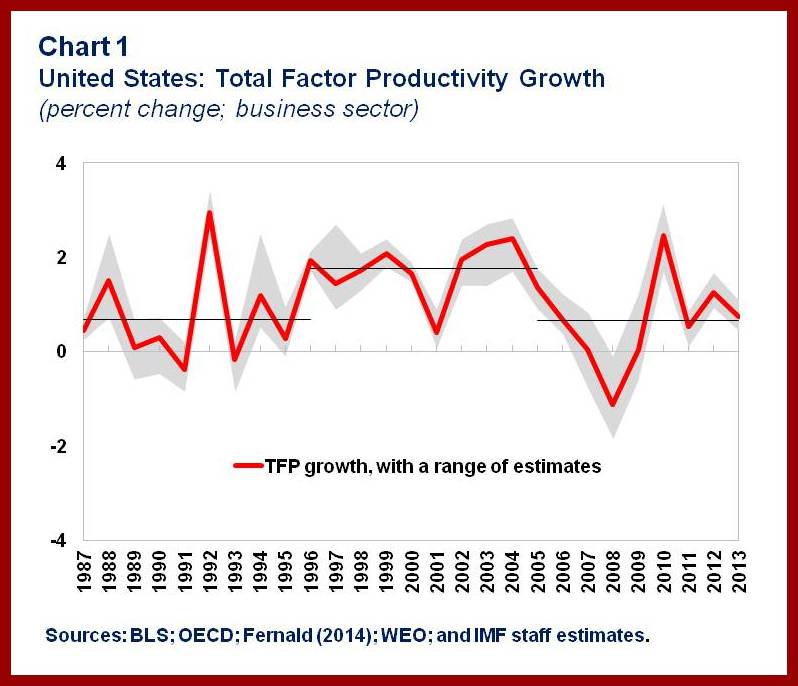
U.S. total factor productivity (productivity gains from the more efficient use of capital and labor, and technological progress) grew at about 1¾ percent a year during 1996–2004. Then the growth rate halved from 2005–13. This trend began well before the financial crisis even started (see Chart 1).
Together with lower labor force participation, this slowdown has meant lower potential growth of the U.S. economy. Our calculations indicate potential output falling from above 3 percent to around 2 percent in the span of a decade.
Technology versus efficiency
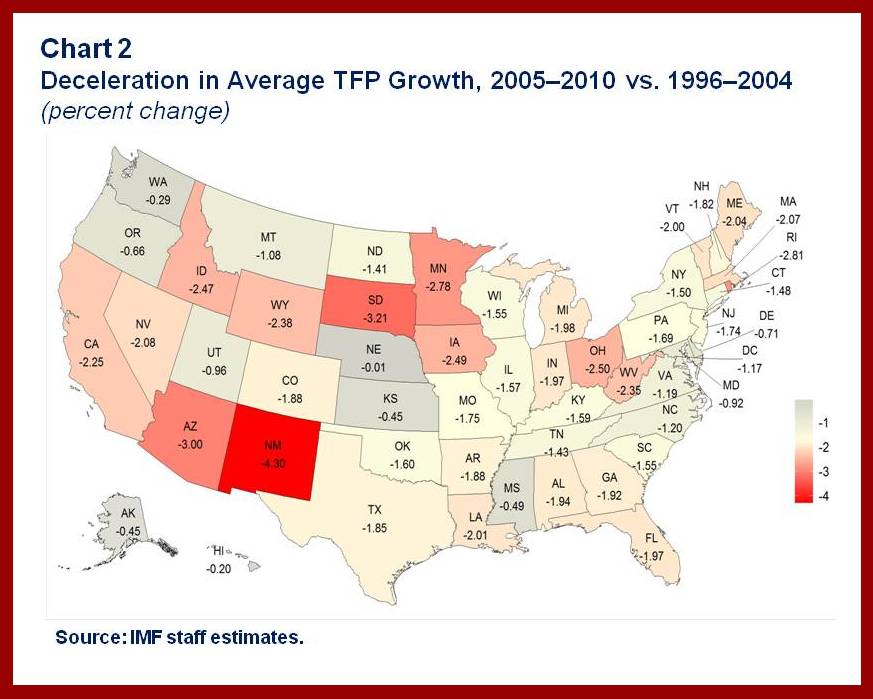
We find that the moderation in total factor productivity growth has been widespread across U.S. states, but the degree to which it has happened has varied greatly. The decline ranges from over 3 percentage points in New Mexico and South Dakota to below 1 percentage point in states like Washington, Oregon, Nebraska, and Maryland (see Chart 2).
The Oregon and New Mexico comparison tells us that the reasons for this different performance must go well beyond the winding down of the tech boom. If it were just a tech story, we should have seen a closer relationship between the states’ productivity performance and specialization in information technology. Instead, we see almost no relationship between the extent to which states either produce or use information technology and the change in productivity growth.
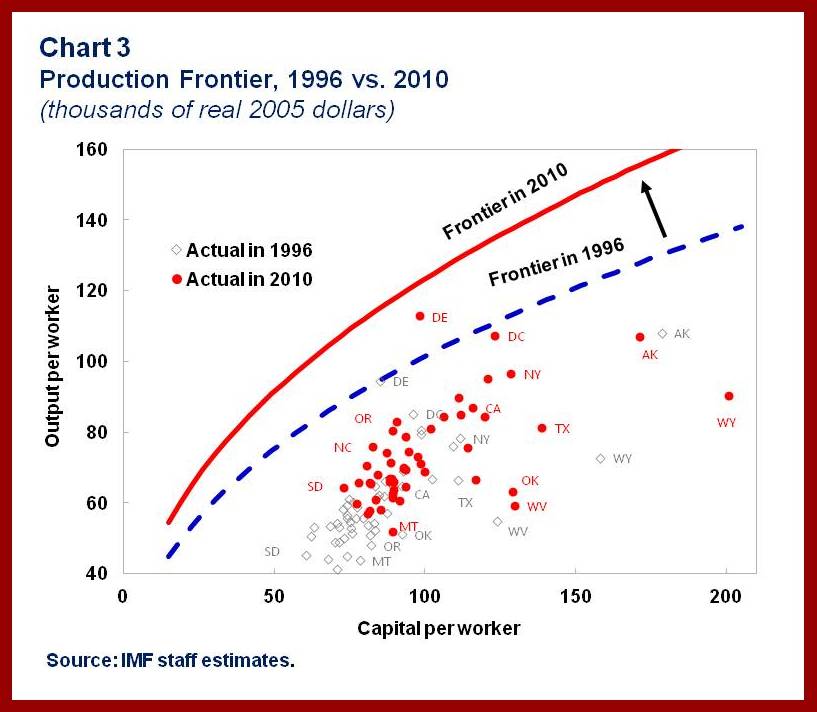
The explanation lies in the fact that, while innovation matters, it’s just one ingredient in productivity. Another important dimension is the efficiency with which firms and states combine those innovation gains with their labor, land, capital, and other inputs. Think back to your college economics classes and picture “progress” as being split up into moving outwards the “production frontier”—the maximum amount of output that can be obtained from a fixed amount of resources—and closing the distance to the nirvana of the frontier by becoming more “efficient."
Our work shows that there is a large variation in efficiency across U.S. states (see Chart 3). On average, U.S. states have been moving somewhat further from that frontier, falling short of deploying new technology and ways of creating value added. If every state had been able to keep up with the average efficiency of the country, real GDP per worker in 2010 would have been 3 percent higher than it actually was. This translates into $400 billion in additional consumption, investment, and exports (over $1,000 for every American man, woman, and child).
How to get to nirvana
Our analysis shows that those states that do better have more years of schooling, better educational attainment, more research and development spending, and a bigger financial sector. We find the same result when trying to explain why productivity growth differed across U.S. states over the past two decades.
The implications for policies are clear. Focus public policy efforts on facilitating investment in human capital, innovation, knowledge creation, and improving financial intermediation.
Let’s look again at Oregon and New Mexico. Over the past 15 years in the Beaver State, the average years of schooling have increased three times as much as that in the Land of Enchantment. Similarly, business research and development spending in Oregon is 1½ percent of GDP more than that in New Mexico.


