Welfare Versus GDP: What Makes People Better Off
IMF Blog, March 7, 2018
Source details
- Canonical URL
- Welfare Versus GDP: What Makes People Better Off
Other formats
Bibliographic details
- Authors: Geoffrey Bannister, Alexandros Mourmouras
- Published: March 7, 2018
Overview of the well-being index
- The index is a consumption-equivalent measure that:
- Measures welfare derived from consumption,
- Adds the value of leisure (or home production),
- Subtracts costs related to inequality,
- Multiplies the annual result by life expectancy to obtain average expected lifetime welfare.
- The index follows the approach proposed by Charles Jones and Peter Klenow (American Economic Review, 2016) combining consumption with three non-market factors—leisure, excessive inequality, and mortality.
- The authors updated and extended this work in their working paper Welfare vs. Income Convergence and Environmental Externalities, attempting to include measures of environmental effects and sustainability.
Key empirical findings
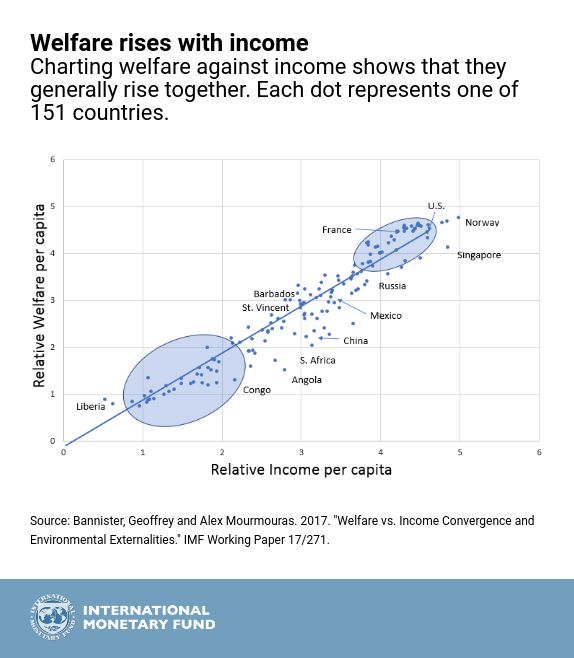
- There is a close relationship between per capita welfare and per capita income or GDP across 151 countries in 2014.
- Most countries align fairly well along the 45-degree line comparing relative welfare and income per capita, indicating correlation but with significant differences.
- Distributional patterns by income quintile:
- The top fifth of countries based on income has a combined welfare index almost 7 percent below the US benchmark.
- The bottom fifth’s index is about 95 percent lower than that of the US.
- Consumption explains most of the difference in welfare between countries at different income levels.
- Richer countries in the top two-fifths benefit from higher life expectancy and lower inequality.
- Poorer countries in the bottom three-fifths have lower life expectancy and higher inequality, contributing to lower welfare.
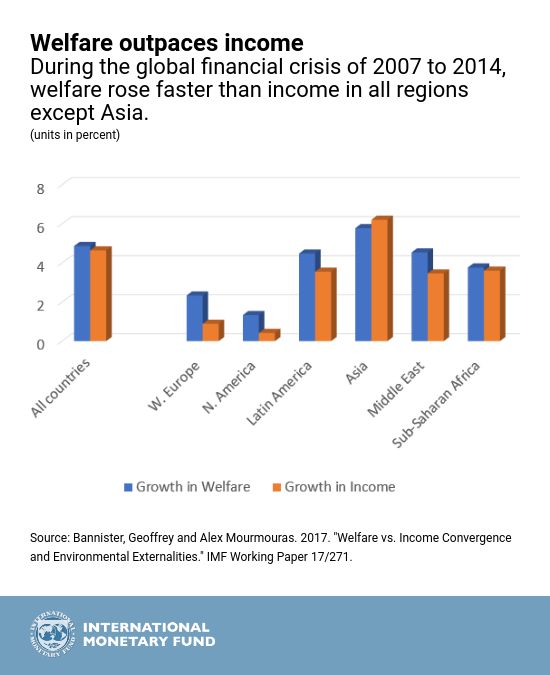
- Welfare grew more quickly than income during the recent global financial crisis, especially for countries hardest hit in Western Europe and North America.
- The only exception cited is Asia, which had an impressively high level of growth in both income and welfare.
Interpretation and implications
- Per capita income or GDP captures the main component of well-being despite being an imperfect measure.
- Non-market factors—life expectancy (health), leisure, and inequality—meaningfully adjust measured welfare relative to income.
- Health is a key component:
- Poor health leads to lower life expectancy and imposes a significant welfare cost on poorer countries.
- Health improvements directly elevate welfare and also support higher incomes and future welfare through higher productivity and reduced employment disruptions.
Policy recommendations
- Continue focusing on policies that increase income and production efficiency:
- Promote macroeconomic and financial stability.
- Implement structural reforms to improve the efficiency of markets.
- Prioritize health-improving policies to raise welfare, including:
- Improving access to healthcare, nutrition, and clean water.
- Improving the quality of care.
- Taxing unhealthy behaviors such as smoking.
- Recognize that health improvements generate a virtuous cycle by raising welfare directly and supporting higher incomes and future welfare gains.
Source: Welfare Versus GDP: What Makes People Better Off — IMF blog, March 7, 2018
References
- https://www.imf.org/wp-content/uploads/2018/03/BLOG-1024x600-Downtown-Oslo-Norway-Central-Station-iStock-859335926.jpg
- here
- https://www.imf.org/wp-content/uploads/2018/03/eng-march-5-welfare-10.jpg
- https://www.imf.org/wp-content/uploads/2018/03/eng-march-5-welfare-11.jpg
- https://www.imf.org/wp-content/uploads/2018/03/eng-march-5-welfare-12.jpg