The slope of the yield curve in the US has inverted in recent months, making long-term debt significantly cheaper than short-term debt. This inversion is a gauge of investors’ confidence in the economy and signals doubts about future growth.
The slope of the Treasury yield curve is the difference between the interest rate on long-term and short-term debt; and each time the curve inverts, there are questions about the reliability of the signal. For example, the fact that interest rates have been low for a prolonged period may change the information provided by the yield curve. Moreover, due to unconventional monetary policies, central banks hold a significant share of outstanding long-term bonds, which influences the “long end” of the yield curve.
The inversion of the yield curve points to increased concerns about risks to growth.
GDP growth ahead
As we show in the October 2018 Global Financial Stability Report, the slope of the yield curve gives us information on the range of possibilities for future growth. And we use our growth-at-risk framework to analyze the potential impact of the recent yield curve inversion on future real GDP growth.
The chart below shows a baseline distribution of one-year-ahead real GDP growth (the blue line) that includes the latest quarterly real GDP growth (as well as an estimated trend), using data beginning in 1975.

The shaded region shows the same distribution when the model includes the most recent difference between 10-year and three-month US Treasury yields. Adding that yield curve slope to the baseline specification has important implications for the range of possibilities for future GDP growth. We show that the odds of lower growth are substantially higher when we incorporate information about the slope of the yield curve.
To assess the extent of investor concern about the risks to growth, we look at the range of “severely adverse” growth outcomes—those that occur with 5 percent probability, also called the “left tail” of the distribution. As shown in the chart, there is a 5 percent probability that US GDP will shrink 4.6% or more four quarters from now. Compared to the baseline distribution, this shift to the left of the distribution implies significantly greater risks to growth.
This next chart compares the 5 percent odds of a negative outcome and the median of the distribution with the slope included over the last four decades. While the median forecasts of GDP growth remain consistently in a relatively narrow range, the left tail of the distribution decreases significantly ahead of recessions.
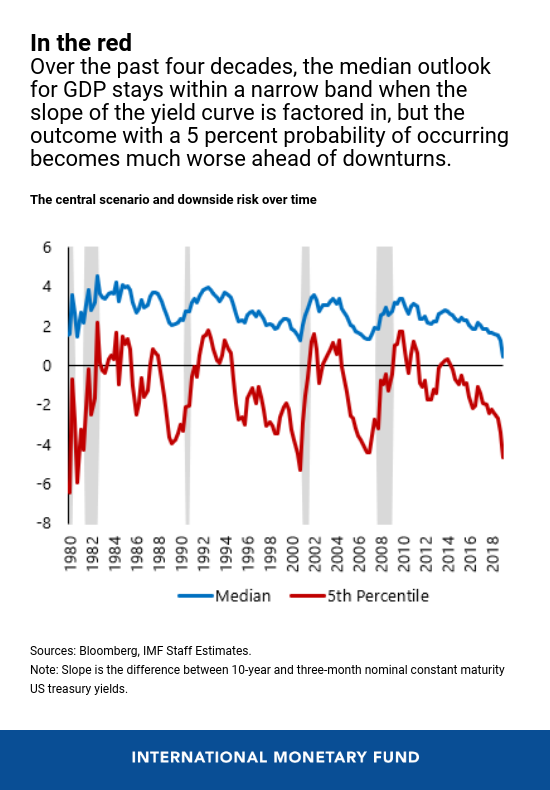
These results suggest that the inversion of the yield curve points to increased concerns about risks to growth. However, it is important to note that the most likely scenario is one of continued positive albeit somewhat lower growth.