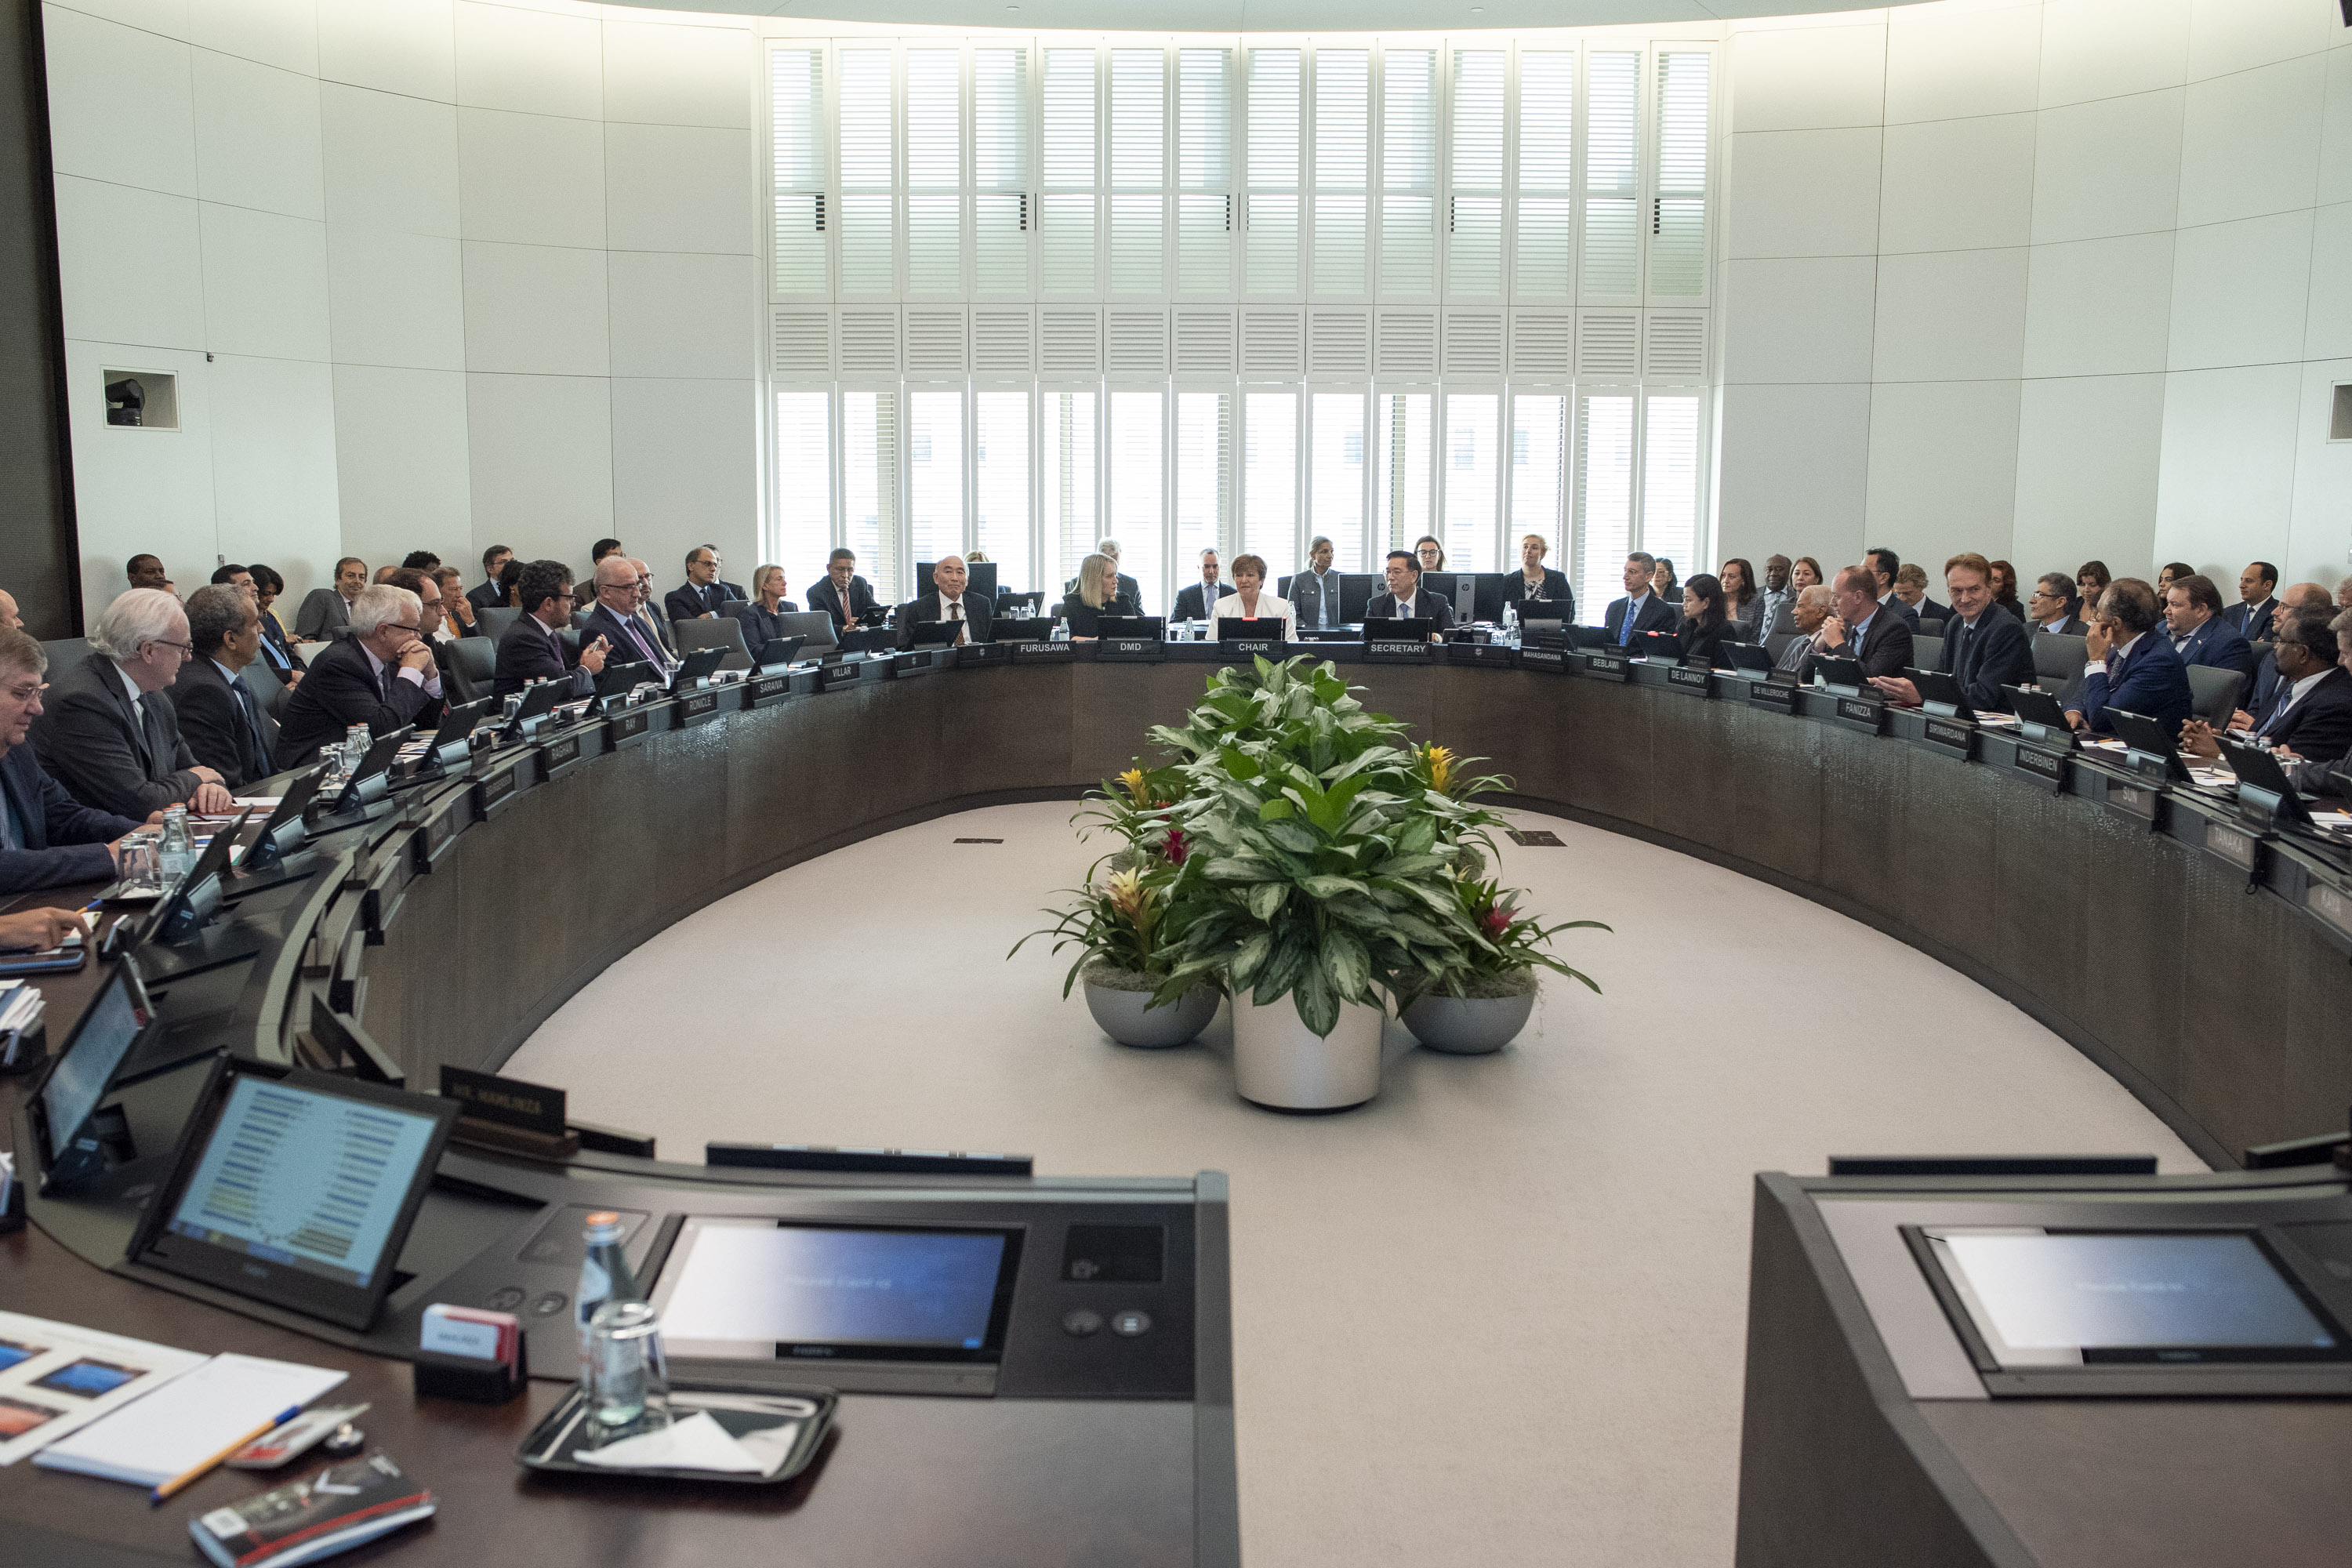
IMF Executive Board Concludes 2017 Article IV Consultation with Bolivia
IMF News, December 22, 2017
Source details
- Canonical URL
- IMF Executive Board Concludes 2017 Article IV Consultation with Bolivia
Other formats
Bibliographic details
- Published: December 22, 2017
Summary of recent performance and outlook
- Bolivia achieved impressive economic and social advances from 2006–2014; real GDP averaged about 5.1 percent annually and the share of population living in the extreme poverty fell by one half.
- Since the decline in natural gas and minerals prices in 2014, the government implemented counter-cyclical macro policies and pursued a state-led development plan; this supported growth but contributed to large fiscal and external current account deficits and foreign reserve losses.
- Real GDP is expected to grow by 4 percent in 2017, with growth forecast to moderate gradually to 3.7 percent in the medium term.
- Key risks to the outlook: failure to discover new natural gas fields, further dollar strength, or lower-than-expected gas and minerals prices.
Executive Board assessment and policy orientation
- Executive directors endorsed the staff appraisal and recommended rebalancing policies in view of the low commodity price outlook.
- Policy objectives emphasized:
- Tighten the macro policy stance and reallocate social spending to anchor stability, raise confidence, and preserve social gains.
- Support policy tightening with structural reforms to raise private investment and shift growth toward non-extractive sectors.
- Take a gradual approach leveraging existing buffers and guided by a clear medium-term policy framework.
Fiscal policy recommendations
- Fiscal policy should be tightened and made consistent with the macro-framework anchored by the nominal exchange rate.
- Staff recommend a moderate reduction in the non-hydrocarbon deficit by about 1.2 percent of GDP per year aimed at stabilizing public debt and slowing reserve losses while still providing space for social development objectives.
- Most of the fiscal tightening should come from the spending side; specific measures include:
- Gradual reduction in the wage bill-to-GDP ratio.
- Streamlining public investment and focusing it on priority infrastructure, health and education, and raising investment efficiency.
- Consider introducing a progressive personal income tax for high income earners.
- Reform the tax system for the hydrocarbon and mineral sectors to promote investment.
- Key structural fiscal reforms:
- Establish a comprehensive MTFF including a multi-year budget covering all public-sector entities, a target for the non-hydrocarbon primary balance, and independent and public risk assessments.
- Reform fiscal federalism to ensure predictability, clarity of responsibilities, scope for own-source revenues, and objective criteria for transfers.
- Strengthen the legal framework governing SOEs and include operations of all subsidiaries in the NFPS.
Monetary and financial sector recommendations
- Central bank independence should be fortified.
- As inflation rises toward the BCB’s projection of 4.5 percent, the monetary policy impulse should be withdrawn.
- The BCB’s exposure to SOEs should be unwound and direct central bank lending to enterprises shifted to the central government budget as transfers or net lending, or undertaken by the financial sector.
- Financial sector reforms and regulatory changes:
- Modify provisions of the FSL: remove targets on productive sector lending and phase out interest rate caps.
- Consider more market-oriented mechanisms to improve financial access and monitor the housing loan portfolio closely.
- ASFI should accelerate efforts to make financial sector supervision more risk-based and forward-looking, enhance analytical capacity, and coordinate better with APS.
- Government encouraged to approve and implement the AML/CFT national action plan.
Social spending and subsidies
- Most social spending in Bolivia is regressive and warrants review.
- Clear case for removing broad-based fuel price subsidies and offsetting the impact on the poorest with targeted support; reforms should be well planned and accompanied by a detailed communications plan.
- Make social spending more effective by focusing on those most in need, including introducing progressive fees for high-income earners.
Structural and sectoral reforms to boost private investment and diversification
- Promote sustainable inclusive growth by expanding non-hydrocarbon traded sectors.
- Wage growth should be aligned with inflation, productivity growth and other objective criteria; reform wage setting institutions and processes.
- Reconsider strategy of expanding state companies into commercial sectors and intervening with restrictions and price controls; seek alternative methods to ensure domestic supplies and offset impacts on the poor with targeted programs.
- To promote hydrocarbon and mining exploration, consider revising investment and taxation regimes.
Data, transparency, and statistical recommendations
- Data provision is adequate but priority reforms are needed:
- Complete the work to rebase GDP (of critical importance).
- Publish macroeconomic data on a pre-announced timely schedule to improve transparency and efficiency.
- Compile external debt data according to BPM6 norms following recent external sector TA.
Selected economic and social indicators (as presented)
- Social and demographic indicators:
- GDP per capita (U.S. dollars, 2016): 3,105
- Poverty headcount ratio (percent of population, 2015): 38.6
- Population (millions, 2016): 10.9
- Gini index (2015): 45.8
- Life expectancy at birth (years, 2015): 69
- Adult literacy rate (percent, 2015): 92.5
- Mortality rate, under-5 (per thousand, 2016): 36.9
- Gross enrollment ratio, primary, both sexes (2015): 97.1
- Baseline projections: Income and prices (Annual percentage changes)
- Real GDP: 2014: 5.5; 2015: 4.9; 2016: 4.3; 2017: 4.0; 2018: 3.9; 2019: 3.8
- Real GDP excluding hydrocarbons: 2014: 5.4; 2015: 5.0; 2016: 5.3; 2017: 4.6
- Nominal GDP: 2014: 7.6; 2015: 0.0; 2016: 2.4; 2017: 8.7; 2018: 8.4; 2019: 7.8
- CPI inflation (period average): 2014: 5.8; 2015: 4.1; 2016: 3.6; 2017: 3.1; 2018: 4.5
- Investment and savings (In percent of GDP)
- Total investment: 2014: 21.0; 2015: 20.3; 2016: 20.8; 2017: 19.7; 2018: 19.0
- Of which: Public sector: 2014: 12.4; 2015: 13.5; 2016: 13.0; 2017: 12.0; 2018: 11.5
- Gross national savings: 2014: 14.2; 2015: 15.1; 2016: 14.4; 2017: 13.7; 2018: 13.4
- Combined public sector (selected items, percent of GDP)
- Revenues and grants: 2014: 39.9; 2015: 37.7; 2016: 33.2; 2017: 31.6; 2018: 31.8
- Of which: Hydrocarbon related revenue: 2014: 12.7; 2015: 9.1; 2016: 5.1
- Expenditure: 2014: 43.3; 2015: 44.6; 2016: 39.8; 2017: 39.0; 2018: 38.3; 2019: 37.8
- Current: 2014: 28.2; 2015: 29.1; 2016: 25.0; 2017: 25.3; 2018: 25.2
- Capital 2/: 2014: 15.0; 2015: 15.5; 2016: 14.8; 2017: 13.1; 2018: 12.6
- Net lending/borrowing (overall balance): 2014: -3.4; 2015: -6.9; 2016: -6.6; 2017: -7.3; 2018: -6.7; 2019: -6.0
- Of which: Non-hydrocarbon balance: 2014: -13.2; 2015: -14.0; 2016: -10.6; 2017: -10.8; 2018: -10.1
- Total gross NFPS debt 3/: 2014: 37.0; 2015: 40.6; 2016: 46.2; 2017: 49.8; 2018: 51.6; 2019: 52.8
- External sector
- Current account 1/: 2014: 1.7; 2015: -5.7; 2016: -5.8; 2017: -5.9; 2018: -5.5
- Exports of goods and services: 2014: 42.1; 2015: 29.8; 2016: 24.1; 2017: 23.3; 2018: 22.7; 2019: 22.3
- Of which: Natural gas: 2014: 18.1; 2015: 11.3; 2016: 6.0; 2017: 6.2; 2018: 5.6
- Imports of goods and services: 2014: 38.9; 2015: 35.6; 2016: 31.5; 2017: 29.4; 2018: 28.8; 2019: 28.3
- Terms of trade index (percent change): 2014: 2.1; 2015: -23.1; 2016: -15.4; 2017: 6.9; 2018: -0.5; 2019: -2.8
- Net Central Bank foreign reserves 4/ 5/ (In millions of U.S. dollars): 2014: 15,123; 2015: 13,056; 2016: 10,081; 2017: 9,875; 2018: 8,780; 2019: 7,518
- In months of imports of goods and services: 2014: 14.1; 2015: 13.2; 2016: 7.4
- Money and credit (Annual percentage changes, unless otherwise indicated)
- Credit to the private sector: 2014: 17.6; 2015: 12.2; 2016: 11.2; 2017: 10.6
- Credit to the private sector (percent of GDP): 2014: 43.7; 2015: 51.4; 2016: 57.6; 2017: 59.5; 2018: 61.0; 2019: 62.6
- Broad money: 2014: 15.6; 2015: 16.2; 2016: 2.6; 2017: 7.1; 2018: 8.3
- Broad money (percent of GDP): 2014: 70.3; 2015: 81.7; 2016: 81.8; 2017: 80.6; 2018: 80.8; 2019: 81.2
- Memorandum items:
- Nominal GDP (in billions of U.S. dollars): 2014: 34.1; 2015: 40.1
- REER, period average (percent change): 2014: 7.9; 2015: 0.1; 2016: 1.4
Source: IMF Communications Department, "IMF Executive Board Concludes 2017 Article IV Consultation with Bolivia", December 22, 2017.