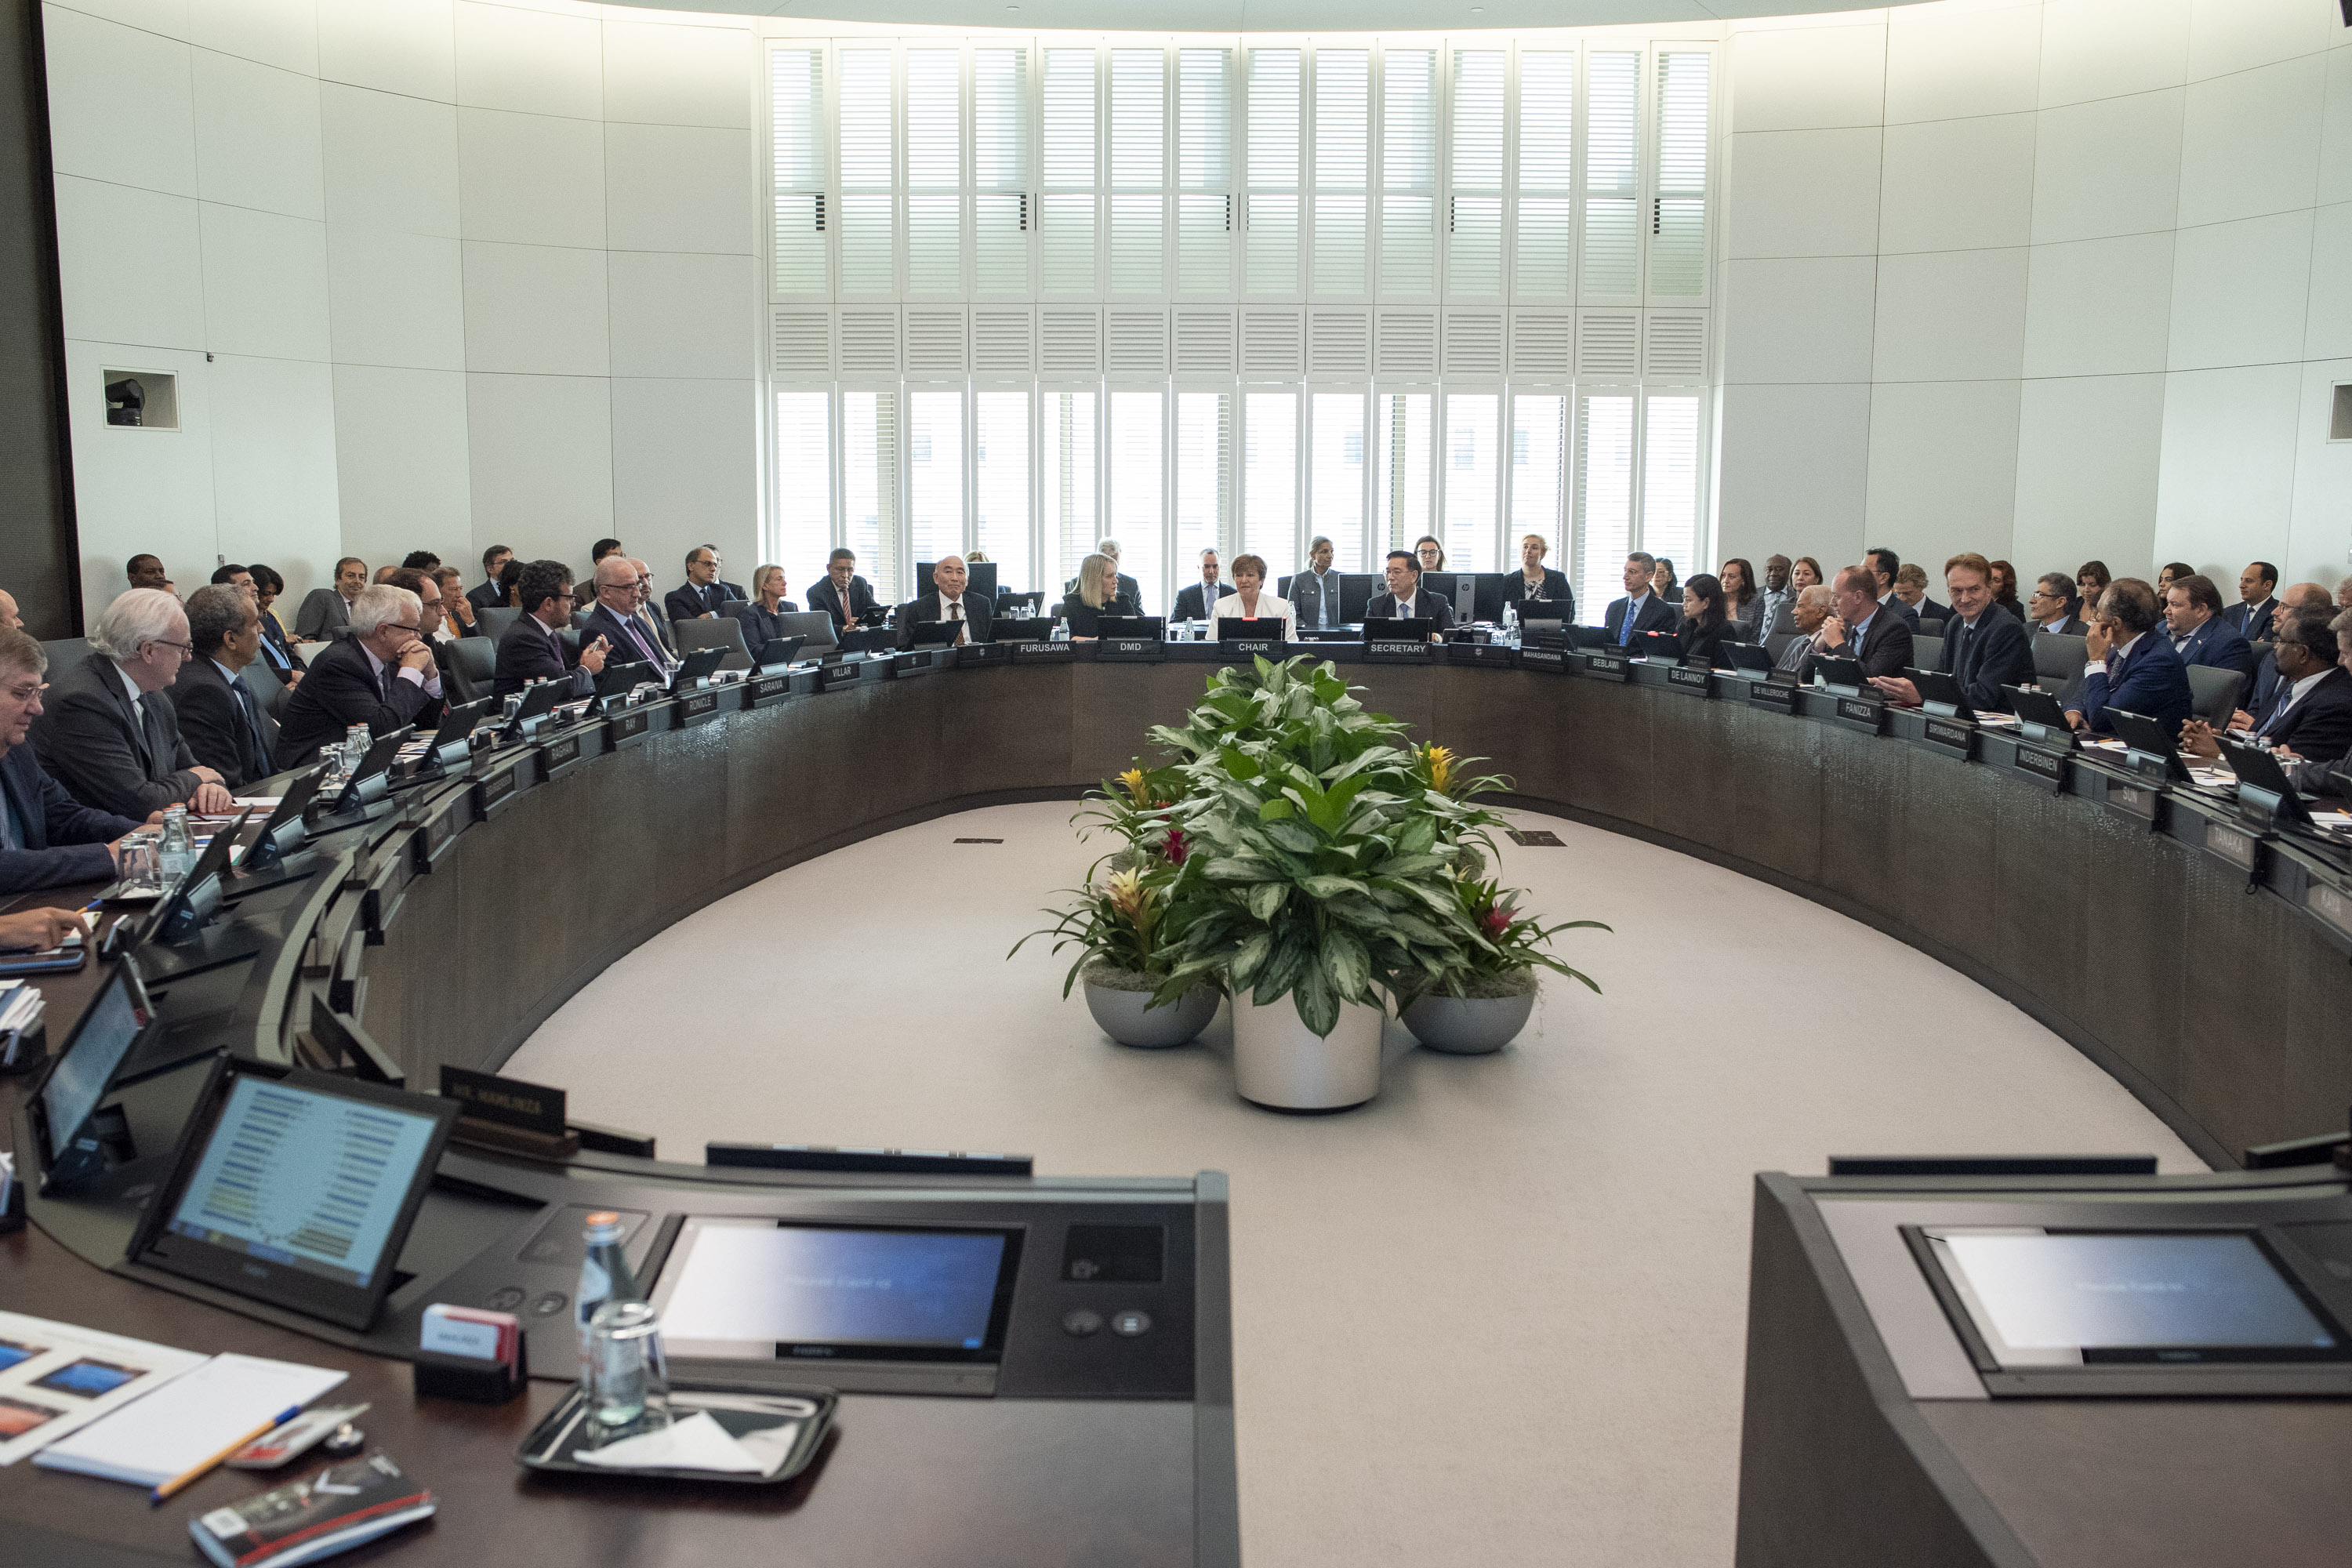
IMF Executive Board Concludes 2018 Article IV Consultation with the Republic of Belarus
IMF News, January 18, 2019
Source details
- Canonical URL
- IMF Executive Board Concludes 2018 Article IV Consultation with the Republic of Belarus
Other formats
Bibliographic details
- Published: January 18, 2019
Growth, external accounts, and inflation — Findings
- Real GDP growth in the first three quarters of 2018 reached 3.7 percent.
- The current account deficit could reach 2½ percent of GDP in 2018, versus 1.6 percent in 2017.
- Inflation was 5 percent y/y in November 2018.
- The exchange rate has remained relatively stable on a nominal effective basis, as have international reserves.
- Higher oil prices and robust external demand supported exports; domestic demand was boosted by double-digit wage growth tied to ambitious wage targets.
- Stronger imports, including related to the nuclear power plant construction, contributed to some deterioration in the external accounts despite positive terms of trade.
- Budget revenues could increase by some ¾ percentage points of GDP in 2018 relative to 2017, but expenditures—particularly capital spending, wages and salaries—have been rising faster.
- The overall budget deficit including quasi-fiscal spending on state-owned enterprises could reach 1.3 percent of GDP in 2018, from 0.3 percent in 2017.
- The deficit is projected to fall modestly over the medium-term to about ½ percent of GDP, notably thanks to the planned completion of the nuclear power plant.
- Medium-term growth is projected at 2 percent absent vigorous structural reforms; this projection is conditional on full compensation from Russia for losses triggered by Russia’s new energy taxation system (the so-called tax maneuver).
- Key risk: if compensation from Russia is significantly less than full, medium-term growth could be materially lower than 2 percent, and the budget and current account deficits higher than projected.
Executive Board assessment and policy recommendations
- Main risks highlighted:
- Rapidly rising public debt.
- High dollarization.
- Uncertainty about negative spillovers from Russia’s new energy taxation system.
- Fiscal policy:
- Directors encouraged authorities to undertake additional consolidation, spread over the next three years, to achieve a credible medium-term debt target balancing development needs and fiscal sustainability.
- Directors encouraged monitoring fiscal risks from state-owned enterprises (SOEs) and gradually switching funding toward rubel-denominated debt to reduce exchange rate susceptibility.
- Monetary and financial policy:
- Directors agreed on the importance of continued central bank independence and supported the current monetary policy stance, which is consistent with the inflation target goal.
- Directors welcomed continued progress towards inflation targeting and commended liberalization of the FX market and reductions in directed lending.
- It will be important to eliminate interest rate caps.
- Directors encouraged continued efforts to strengthen financial sector stability and welcomed progress on implementing FSAP recommendations; they urged implementation of remaining recommendations.
- Directors emphasized the need to further reduce high dollarization and to develop local capital markets as a key component of successful de-dollarization.
- Structural reforms and social policy:
- Directors called for a comprehensive reform of state-owned enterprises via a systematic, risk-based assessment of SOEs’ viability followed by an actionable restructuring plan.
- Directors underscored the need for enhanced social safety nets to cushion the impact of restructuring on vulnerable groups.
- Facilitating private sector activity by improving the business climate and leveling the playing field was highlighted as important.
Selected economic indicators (baseline) — Key statistics (2016–2023)
- Real GDP (percentage change):
- 2016: -2.5
- 2017: 2.4
- 2018: 3.7
- 2019: 2.4
- 2020: 2.8
- 2021: 2.3
- 2022: 2.0
- 2023: (table lists values under projections)
- Total domestic demand (percentage change):
- 2016: -5.4
- 2017: 4.0
- 2018: 4.8
- 2019: 3.1
- 2020: 2.0
- 2021: 1.5
- 2022: 1.8
- 2023: 2.1
- Consumer prices:
- End of period 2016: 10.6
- End of period 2017: 4.6
- End of period 2018: 5.5
- Average 2016: 11.8
- Average 2017: 6.0
- Net credit to the economy (percent of GDP):
- 2016: 41.5
- 2017: 40.2
- 2018: 40.1
- 2019: 41.0
- 2020: 41.4
- 2021: 42.6
- 2022: 43.1
- 2023: 44.7
- Net credit to private sector (percent of GDP):
- 2016: 21.7
- 2017: 22.4
- 2018: 22.9
- 2019: 23.5
- 2020: 24.3
- 2021: 25.7
- 2022: 26.6
- 2023: 27.9
- Current account balance (percent of GDP):
- 2016: -3.4
- 2017: -1.6
- 2018: -2.6
- 2019: -4.0
- 2020: -2.3
- 2021: -2.4
- 2022: -2.2
- Trade balance, goods (percent of GDP):
- 2016: -5.3
- 2017: -5.9
- 2018: -5.6
- 2019: -4.3
- 2020: -4.1
- 2021: -4.1
- Exports of goods (percent of GDP):
- 2016: 48.4
- 2017: 52.7
- 2018: 53.3
- 2019: 52.5
- 2020: 53.8
- 2021: 54.3
- 2022: 53.7
- Imports of goods (percent of GDP):
- 2016: 58.0
- 2017: 59.2
- 2018: 58.1
- 2019: 58.3
- 2020: 57.7
- 2021: 56.8
- Gross external debt (percent of GDP):
- 2016: 78.6
- 2017: 73.3
- 2018: 68.3
- 2019: 69.0
- 2020: 67.5
- 2021: 66.8
- 2022: 66.1
- 2023: 64.3
- Public gross external debt (percent of GDP):
- 2016: 36.9
- 2017: 37.7
- 2018: 36.2
- 2019: 38.9
- 2020: 37.5
- 2021: 36.7
- 2022: 36.1
- 2023: 34.9
- Private gross external debt (including SOEs) (percent of GDP):
- 2016: 41.7
- 2017: 35.7
- 2018: 32.1
- 2019: 30.1
- 2020: 30.0
- 2021: 29.5
- Net international investment position (percent of GDP):
- 2016: -85.6
- 2017: -75.9
- 2018: -72.0
- 2019: -72.8
- 2020: -72.1
- 2021: -71.7
- 2022: -71.1
- 2023: -69.5
- Gross domestic investment (percent of GDP):
- 2016: 26.5
- 2017: 26.2
- 2018: 27.0
- 2019: 27.7
- 2020: 26.7
- 2021: 26.8
- National saving (percent of GDP):
- 2016: 23.1
- 2017: 24.7
- 2018: 24.5
- 2019: 23.7
- 2020: 24.4
- 2021: 24.8
- General government primary balance (percent of GDP):
- 2016: 2.5
- 2017: 1.7
- 2018: 0.2
- 2019: 3.2
- 2020: 3.1
- General government overall balance (percent of GDP):
- 2016: 0.5
- 2017: -0.3
- 2018: 0.4
- Overall balance 2/ (percent of GDP):
- 2016: -3.9
- 2017: -1.2
- 2018: -0.8
- Gross public and publicly guaranteed debt (percent of GDP):
- 2016: 53.5
- 2017: 53.4
- 2018: 51.7
- 2019: 54.1
- 2020: 55.4
- 2021: 55.7
- 2022: 56.0
- Nominal GDP (billions of U.S. dollars):
- 2016: 47.7
- 2017: 54.4
- 2018: 59.6
- 2019: 62.4
- 2020: 65.2
- 2021: 67.6
- 2022: 70.1
- 2023: 73.8
- Nominal GDP (billions of BYN):
- 2016: 94.9
- 2017: 105.2
- 2018: 121.2
- 2019: 130.3
- 2020: 141.1
- 2021: 150.1
- 2022: 159.1
- 2023: 168.2
- Terms of trade, percentage change:
- 2016: -5.2
- 2017: 1.1
- 2018: -0.4
- 2019: -0.7
- Real Effective Exchange Rate:
- 2016: -9.2 ( "-" denotes a depreciation)
- Nominal Effective Exchange Rate:
- 2016: -17.5 ( "-" denotes a depreciation)
- 2017: -4.9
- Official reserves (billions of U.S. dollars):
- 2016: 6.6
- 2017: 7.1
- 2018: 7.5
- Months of imports of goods and services:
- 2016: 1.6
- Percent of short-term debt:
- 2016: 46.4
- 2017: 75.3
- 2018: 68.1
- 2019: 71.9
- 2020: 71.0
- 2021: 70.7
- 2022: 70.6
- 2023: 70.4
- Quota (2016): SDR 681.5 million (923.5 million U.S. dollars)
Source: IMF Executive Board press release, January 17, 2019.
References
- https://www.imf.org/-/media/images/imf/bios/imfboard.jpg
- The Executive Board
- Republic of Belarus and the IMF
- Russian Federation and the IMF
- IMF Policy Advice -- A Factsheet
- Press Releases
- PRESS CENTER
- http://www.imf.org/external/np/sec/misc/qualifiers.htm.
- http://www.imf.org/external/np/sec/misc/qualifiers.htm.
- https://www.imf.org/en/home