A Tale of Two States—Bringing Back U.S. Productivity Growth
IMF Blog, September 25, 2014
Source details
- Canonical URL
- A Tale of Two States—Bringing Back U.S. Productivity Growth
Other formats
Bibliographic details
- Authors: Roberto Cardarelli, Lusine Lusinyan
- Published: September 25, 2014
Overview of the U.S. productivity story
- U.S. total factor productivity (productivity gains from the more efficient use of capital and labor, and technological progress) grew at about 1¾ percent a year during 1996–2004.
- The growth rate halved from 2005–13.
- The slowdown began well before the financial crisis.
- Together with lower labor force participation, this slowdown has meant lower potential growth: potential output falling from above 3 percent to around 2 percent in the span of a decade.
Contrasting cases: Oregon versus New Mexico
- Both states have the highest share of computer and electronic production in the United States and similar information technology usage by businesses.
- Productivity outcome contrast (2005–2010): a $100 investment in capital and labor in Oregon would have yielded a $25 payback, while a similar investment in New Mexico would have paid only $5.
- The divergence implies factors beyond specialization in information technology explain productivity differences.
Technology versus efficiency: key findings
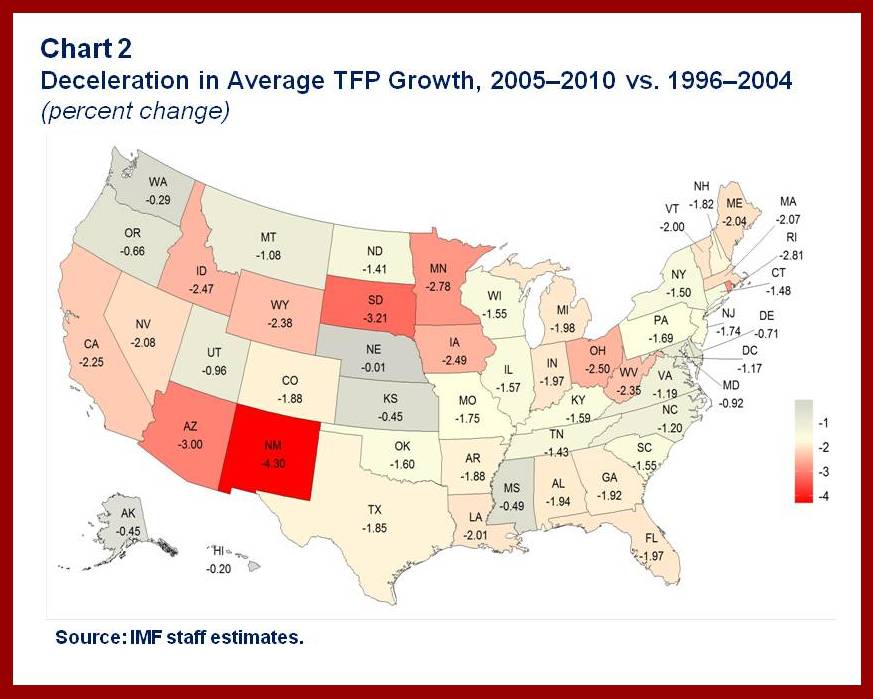
- The moderation in total factor productivity growth has been widespread across U.S. states, but the magnitude varies greatly.
- The decline in productivity growth across states ranges from over 3 percentage points in New Mexico and South Dakota to below 1 percentage point in states like Washington, Oregon, Nebraska, and Maryland.
- There is almost no relationship between the extent to which states produce or use information technology and the change in productivity growth.
- Productivity comprises two components:
- Moving outwards the production frontier (innovation/technology).
- Closing the distance to the frontier by becoming more efficient in combining inputs.
- There is large variation in efficiency across U.S. states.
- On average, U.S. states have been moving somewhat further from the production frontier, falling short of deploying new technology and creating value added.
- Counterfactual: If every state had been able to keep up with the average efficiency of the country, real GDP per worker in 2010 would have been 3 percent higher than it actually was.
- This translates into $400 billion in additional consumption, investment, and exports.
- Equivalent to over $1,000 for every American man, woman, and child.
Determinants of better state performance
- States that perform better on productivity tend to have:
- More years of schooling.
- Better educational attainment.
- More research and development spending.
- A bigger financial sector.
- These same factors help explain differences in productivity growth across U.S. states over the past two decades.
- Empirical contrasts: Over the past 15 years in Oregon, the average years of schooling have increased three times as much as in New Mexico.
- Business research and development spending in Oregon is 1½ percent of GDP more than that in New Mexico.
Policy implications and recommendations
- Public policy should focus on facilitating investment in:
- Human capital.
- Innovation and knowledge creation.
- Improving financial intermediation.
- Emphasis on policies that improve both the production frontier (technology and R&D) and the efficiency of combining inputs to close the gap to the frontier.
Source: A Tale of Two States—Bringing Back U.S. Productivity Growth (Roberto Cardarelli, Lusine Lusinyan, September 25, 2014).
References
- https://www.imf.org/wp-content/uploads/2014/09/newscom_oregon-euphotos006901.jpg
- https://www.imf.org/wp-content/uploads/2014/09/newscom_newmexico-euphotos034421.jpg
- recent work
- lower labor force participation
- https://www.imf.org/wp-content/uploads/2014/09/usblog4-chart-1.jpg
- https://www.imf.org/wp-content/uploads/2014/09/usblog4-chart-2.jpg
- https://www.imf.org/wp-content/uploads/2014/09/usblog4-chart-3.jpg