Who Wins and Who Loses As China Rebalances
IMF Blog, May 12, 2016
Source details
- Canonical URL
- Who Wins and Who Loses As China Rebalances
Other formats
Bibliographic details
- Authors: Serkan Arslanalp, Thomas Helbling, Jaewoo Lee, Koshy Mathai
- Published: May 12, 2016
Summary and context
- Authors: Serkan Arslanalp, Thomas Helbling, Jaewoo Lee, Koshy Mathai
- Date: May 12, 2016
- Central premise: China is shifting its growth model from export-driven to household consumption–centered, and this rebalancing has heterogeneous effects across Asia and the global economy.
Key empirical findings
- China’s regional and global trade footprint expanded markedly during 2000–15:
- Exports to China increased from 3 percent to 9 percent of world exports.
- Exports to China increased from 9 percent to 22 percent of Asian exports.
- Estimated growth spillover magnitude:
- A 1 percentage point change in China’s real GDP growth is estimated to affect the real GDP growth of the median Asian economy by 0.15–0.30 of a percentage point.
- Commodity demand effects:
- As China moves away from investment, demand for raw materials used intensively in investment (iron ore, copper, coal) is declining, contributing to lower commodity prices.
Who is likely to lose
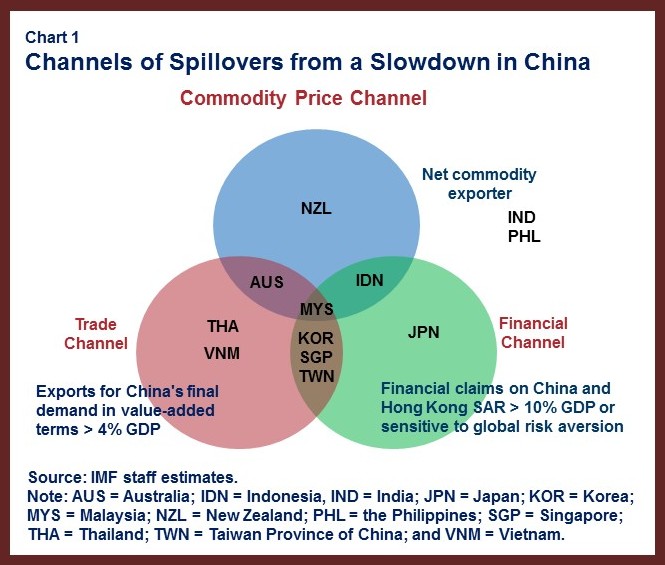
- Commodity exporters vulnerable to lower demand and prices:
- Australia, Indonesia, Malaysia, New Zealand.
- Economies closely integrated with China through global value chains and exposed to China’s investment activity:
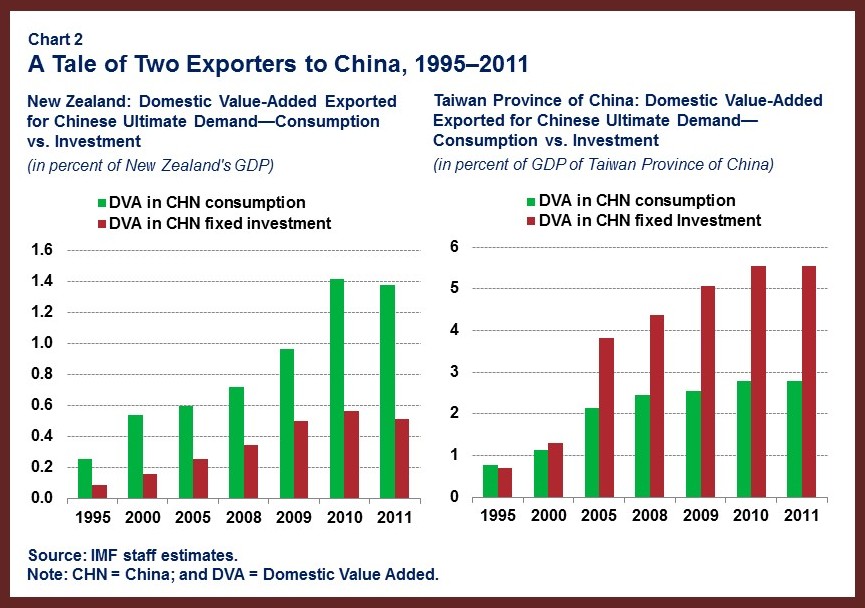
- Korea, Taiwan Province of China.
- Suppliers of technology and capital providers likely to be affected:
- Japan, Korea (technology suppliers); Hong Kong, Singapore (providers of capital).
- Financial channels:
- Financial spillovers from China to regional markets are rising, particularly in equity and foreign exchange markets, due to greater trade links and financial integration (including through Hong Kong and with the internationalization of the renminbi and gradual capital account liberalization).
Who is likely to win / benefit
- Exporters of consumer goods and destinations for Chinese tourism:
- Examples: New Zealand (higher end food), other tourism destinations.
- Low-income Asian countries capturing labor-intensive manufacturing:
- Bangladesh, Cambodia, Vietnam have gained global market share in apparel, footwear, furniture, and plastic toys.
- Opportunities from China’s move to higher value-added production for suppliers of services and certain goods.
Policy recommendations and adaptation strategies
- Diversify growth engines:
- Promote deeper trade and financial integration.
- Promote growth of the services sector as both a response to China’s rebalancing and a new growth source.
- Implement structural reforms supported by growth-friendly fiscal policy to aid transitions, boost potential growth, and alleviate poverty.
- Monetary and exchange-rate policy:
- Maintain supportive monetary policy given low inflation across most of the region.
- Use exchange-rate flexibility as part of risk-management; flexible exchange rates can provide an effective cushion, unless they conflict with external stability.
- Where adequate fiscal space exists, use fiscal policy to smooth adjustment.
- Safeguard financial stability:
- Monitor and address vulnerabilities arising from volatile asset prices and exchange rate movements, including corporate sector risks.
- Consider capital flow management measures to guard against sudden and large-scale cross-border capital flows associated with large external shocks.
Outlook
- In the long run, China’s rebalancing should make its growth model more resilient and sustainable, generating benefits for Asian neighbors.
- In the near term, some countries in the region should expect to feel adverse effects and prepare to adjust policies and economic structures accordingly.
IMF blog post — "Who Wins and Who Loses As China Rebalances", May 12, 2016.