|
| Table 1. Fiscal Indicators, 2008-12 |
| (Percent of GDP) |
|
|
|
|
|
Est. |
Projections |
|
Difference from November 2010 Fiscal Monitor 1 |
| |
|
|
|
|
|
2008 |
2009 |
2010 |
2011 |
2012 |
|
2010 |
2011 |
2012 |
| |
|
Overall Fiscal Balance |
World |
-1.9 |
-6.7 |
-5.5 |
-4.6 |
-3.7 |
|
0.1 |
0.1 |
-0.2 |
| |
|
|
|
|
|
|
|
|
|
|
Advanced economies |
-3.6 |
-8.8 |
-7.5 |
-6.8 |
-5.3 |
|
0.1 |
0.3 |
-0.1 |
|
United States |
-6.5 |
-12.7 |
-10.3 |
-9.9 |
-7.8 |
|
0.3 |
0.9 |
-0.3 |
|
Euro Area |
-2.1 |
-6.4 |
-6.1 |
-4.3 |
-3.4 |
|
-0.1 |
0.2 |
0.3 |
|
France |
-3.4 |
-7.6 |
-7.1 |
-5.8 |
-4.9 |
|
-0.1 |
0.0 |
0.0 |
|
Germany |
0.1 |
-3.0 |
-3.3 |
-1.9 |
-1.1 |
|
0.0 |
0.5 |
0.4 |
|
Italy |
-2.7 |
-5.3 |
-4.5 |
-4.1 |
-3.2 |
|
0.0 |
0.2 |
0.3 |
|
Spain |
-4.2 |
-11.1 |
-9.2 |
-6.2 |
-5.1 |
|
0.0 |
0.0 |
0.6 |
|
Japan |
-4.2 |
-10.3 |
-9.6 |
-10.5 |
-9.1 |
|
-0.1 |
-0.5 |
-0.7 |
|
United Kingdom |
-4.9 |
-10.3 |
-10.2 |
-8.5 |
-7.0 |
|
0.3 |
0.0 |
0.0 |
|
Canada |
0.1 |
-4.9 |
-5.6 |
-3.9 |
-2.6 |
|
-0.1 |
0.7 |
0.2 |
|
|
|
|
|
|
|
|
|
|
|
|
Emerging economies |
-0.4 |
-4.8 |
-3.7 |
-2.7 |
-2.2 |
|
0.1 |
-0.1 |
-0.1 |
|
China |
-0.4 |
-3.1 |
-2.6 |
-1.6 |
-0.7 |
|
0.0 |
0.0 |
0.2 |
|
India |
-7.2 |
-9.7 |
-9.2 |
-8.5 |
-8.1 |
|
0.2 |
-0.2 |
-0.6 |
|
Russia |
4.9 |
-6.3 |
-3.5 |
-1.4 |
-1.6 |
|
0.0 |
0.2 |
0.1 |
|
Brazil |
-1.4 |
-3.1 |
-2.9 |
-2.8 |
-2.9 |
|
0.0 |
-0.4 |
-0.4 |
|
Mexico |
-1.3 |
-4.8 |
-4.1 |
-2.7 |
-2.6 |
|
0.0 |
-0.9 |
-0.2 |
|
South Africa |
-0.5 |
-5.2 |
-5.8 |
-5.7 |
-5.0 |
|
0.0 |
0.0 |
0.0 |
|
|
|
|
|
|
|
|
|
|
|
|
Low-income economies |
-1.4 |
-4.2 |
-3.1 |
-2.9 |
-2.6 |
|
-0.2 |
-0.3 |
-0.2 |
|
|
|
|
|
|
|
|
|
|
|
|
G-20 advanced |
-4.2 |
-9.4 |
-8.1 |
-7.6 |
-6.0 |
|
0.1 |
0.4 |
-0.2 |
|
G-20 emerging |
-0.3 |
-4.8 |
-3.6 |
-2.7 |
-2.3 |
|
0.0 |
-0.2 |
-0.2 |
| |
|
|
|
|
|
|
|
|
|
General Government Cyclically Adjusted Balance (Percent of Potential GDP) |
|
World |
-2.4 |
-4.1 |
-4.4 |
-4.0 |
-3.2 |
|
0.0 |
0.0 |
-0.1 |
|
|
|
|
|
|
|
|
|
|
|
|
Advanced economies |
-3.3 |
-5.5 |
-5.6 |
-5.1 |
-4.2 |
|
0.1 |
0.4 |
0.0 |
|
United States 2 |
-4.6 |
-6.8 |
-7.2 |
-7.2 |
-5.8 |
|
0.3 |
0.9 |
-0.1 |
|
Euro Area |
-2.8 |
-4.6 |
-4.3 |
-3.2 |
-2.6 |
|
0.0 |
0.1 |
0.2 |
|
France |
-2.9 |
-5.2 |
-4.9 |
-4.2 |
-3.6 |
|
0.4 |
0.2 |
0.1 |
|
Germany |
-0.9 |
-1.1 |
-2.4 |
-1.9 |
-1.3 |
|
0.0 |
0.2 |
0.2 |
|
Italy |
-2.4 |
-3.2 |
-2.8 |
-2.5 |
-1.8 |
|
0.0 |
0.2 |
0.3 |
|
Spain |
-5.3 |
-9.7 |
-7.5 |
-4.7 |
-4.1 |
|
0.0 |
0.0 |
0.6 |
|
Japan |
-3.7 |
-7.0 |
-7.7 |
-8.1 |
-7.7 |
|
-0.2 |
0.2 |
-0.3 |
|
United Kingdom |
-5.9 |
-8.5 |
-8.0 |
-6.5 |
-5.1 |
|
0.3 |
0.1 |
0.1 |
|
Canada |
0.0 |
-3.2 |
-4.0 |
-2.9 |
-2.2 |
|
0.0 |
0.7 |
0.0 |
|
|
|
|
|
|
|
|
|
|
|
|
Emerging economies |
-2.2 |
-4.5 |
-4.0 |
-3.3 |
-3.0 |
|
0.0 |
-0.2 |
-0.2 |
|
China |
-0.9 |
-3.4 |
-2.9 |
-1.8 |
-1.0 |
|
0.0 |
0.0 |
0.0 |
|
India |
-9.3 |
-10.7 |
-9.6 |
-8.9 |
-8.6 |
|
0.4 |
-0.1 |
-0.9 |
|
Russia |
3.7 |
-3.4 |
-1.7 |
-0.6 |
-1.3 |
|
0.1 |
0.1 |
0.0 |
|
Brazil |
-2.1 |
-2.0 |
-3.1 |
-3.0 |
-2.9 |
|
-0.1 |
-0.4 |
-0.3 |
|
Mexico |
-1.8 |
-4.5 |
-4.1 |
-3.0 |
-3.0 |
|
0.0 |
-0.9 |
-0.3 |
|
South Africa |
-2.1 |
-4.8 |
-5.0 |
-4.9 |
-4.4 |
|
0.0 |
0.0 |
0.0 |
|
|
|
|
|
|
|
|
|
|
|
|
G-20 advanced |
-3.4 |
-5.5 |
-5.8 |
-5.6 |
-4.5 |
|
0.2 |
0.5 |
0.0 |
|
G-20 emerging |
-2.1 |
-4.6 |
-4.0 |
-3.3 |
-2.9 |
|
0.0 |
-0.2 |
-0.2 |
| |
|
|
|
|
|
|
|
|
|
General Government Gross Debt |
|
World |
57.6 |
64.7 |
67.0 |
69.3 |
70.3 |
|
-0.2 |
-0.1 |
0.1 |
| |
|
|
|
|
|
|
|
|
|
|
Advanced economies |
79.4 |
91.5 |
96.8 |
101.9 |
104.1 |
|
0.3 |
0.4 |
0.4 |
|
United States |
71.2 |
84.5 |
91.2 |
98.3 |
102.3 |
|
-0.3 |
-1.2 |
-0.6 |
|
Euro Area |
69.7 |
79.1 |
85.4 |
87.9 |
88.7 |
|
1.3 |
1.3 |
1.0 |
|
France |
68.3 |
79.0 |
82.4 |
84.8 |
86.6 |
|
0.6 |
-0.1 |
-0.3 |
|
Germany |
66.3 |
73.4 |
83.2 |
82.3 |
81.0 |
|
3.2 |
2.2 |
1.5 |
|
Italy |
106.3 |
116.1 |
119.0 |
120.6 |
120.3 |
|
0.0 |
0.3 |
0.3 |
|
Spain |
39.8 |
53.3 |
60.1 |
67.5 |
69.7 |
|
0.0 |
3.5 |
2.6 |
|
Japan |
195.0 |
216.3 |
220.4 |
233.2 |
236.7 |
|
0.1 |
4.1 |
3.3 |
|
United Kingdom |
52.0 |
68.3 |
77.1 |
82.9 |
86.5 |
|
-0.2 |
-0.1 |
0.0 |
|
Canada |
71.1 |
83.3 |
83.9 |
82.7 |
81.6 |
|
-0.2 |
-1.5 |
-1.4 |
|
|
|
|
|
|
|
|
|
|
|
|
Emerging economies |
35.3 |
36.7 |
35.3 |
34.6 |
34.3 |
|
-0.7 |
-0.7 |
-0.4 |
|
China |
17.0 |
17.7 |
17.0 |
16.5 |
15.7 |
|
-0.7 |
-0.6 |
-0.5 |
|
India |
74.3 |
74.0 |
68.1 |
66.2 |
65.9 |
|
-4.1 |
-4.5 |
-4.0 |
|
Russia |
7.9 |
11.0 |
11.7 |
11.4 |
12.1 |
|
1.9 |
2.8 |
3.3 |
|
Brazil |
70.7 |
67.9 |
66.1 |
65.6 |
65.2 |
|
0.0 |
-0.1 |
0.2 |
|
Mexico |
43.0 |
44.6 |
42.7 |
42.4 |
42.6 |
|
0.0 |
0.1 |
0.4 |
|
South Africa |
27.3 |
31.5 |
36.3 |
40.5 |
42.8 |
|
0.0 |
0.0 |
0.0 |
| |
|
|
|
|
|
|
|
|
|
|
Low-income economies |
38.9 |
43.1 |
42.1 |
42.3 |
41.3 |
|
-0.2 |
-0.3 |
-0.6 |
|
|
|
|
|
|
|
|
|
|
|
|
G-20 advanced |
84.3 |
97.3 |
102.9 |
108.4 |
110.9 |
|
-0.1 |
-0.1 |
0.0 |
|
G-20 emerging |
35.2 |
35.8 |
33.8 |
32.8 |
32.3 |
|
-0.8 |
-0.7 |
-0.5 |
| |
Sources: IMF staff estimates and projections.
Note: All country averages are PPP-GDP weighted using 2009 weights. Projections are based on IMF staff assessment of current policies.
1 For overall fiscal balance and cyclically adjusted balance, + indicates a smaller fiscal deficit; for gross debt, + indicates a larger debt.
2 Excluding financial sector support recorded above the line.
|
Table 2. Selected European Countries with IMF-Supported Programs: Policy Measures Adopted or Announced for 2011
(Announced impact on 2011 general government balance in percent of GDP)
|
| Country |
Revenue and other receipts |
Expenditure |
Total |
|
| Greece 1 |
Reduction in tax expenditures, including property taxes and VAT; various measures to speed up collection of tax arrears and penalties; measures against fuel smuggling; renewal of Telecom licenses; and extension of airport concessions (2.4 percent of GDP) |
Wage cuts and tariff increases in public enterprises; restructuring of public entities; reduction in public wage bill (e.g. through reduction in short-term contracts and attrition-based reductions in employment); health reforms (drug and other cost savings and increases in co-pay for hospitals); rationalization of entitlements, including means-testing of family benefits; and reductions in transfers to public entities outside general government, operational expenditures, and military deliveries (2.7 percent of GDP) |
5.1 |
| |
|
|
|
| Ireland 2 |
Revisions to PIT bands and credits; integration of health and income levies into universal social charge; tightening of various tax reliefs on private pensions contributions; and reduction in tax expenditures (1.2 percent of GDP) |
Reduction in public payroll and discretionary expenditure, non-progressive social welfare benefits and capital spending (2.6 percent of GDP) |
3.8 |
| |
|
|
|
|
Latvia |
Increase in VAT rate by one percentage point, social contribution rate, excise duties, real estate and car tax, dividend payout ratio of SOEs, financial stability duty, and other nontax revenues (2 percent of GDP) |
Cuts in public employment, goods and services, subsidies and grants, health spending and transfers to local governments; and reform of social benefits (0.8 percent of GDP) |
2.8 |
| |
|
|
|
|
Portugal |
Increase in the VAT standard rate (by 2 percentage points) and PIT and CIT rates; broadening of the SSC base; introduction of a new tax on the banking sector; adoption of tolls; and revision of penalties and fees (2 percent of GDP) |
Reduction in public payroll (cuts in wages and the number of employees); pension freeze; cuts in social transfers and improvement of means-testing; reduction in capital expenditures and intermediate consumption; savings in health/pharmaceutical products; and cuts in transfers to SOEs and local governments (3.7 percent of GDP) |
5.7 |
| |
|
|
|
|
Romania 3 |
Increase in VAT rate by 5 percentage points and excise rates and broadening of the tax base for PIT and SSC (2.1 percent of GDP) |
Public wage and employment cuts, elimination of holiday bonus and 13th salary, pension freeze, cuts in inefficient social benefits, reinforced social inspections, cuts in heating subsidies, and health reforms (2 percent of GDP) |
4.1 |
| |
1 The fiscal impact estimate includes additional measures announced as part of the medium-term fiscal strategy but not yet finalized and approved by Parliament.
2 The fiscally-neutral Jobs Initiative (financed by a temporary levy on private pension funds) reduces lower-tier VAT on some tourism-related items, halves employer social security contribution rate until end-2013, creates new training positions for unemployed, and reorients capital projects for road reconstruction, school maintenance, and home energy efficiency.
3 The VAT rate hike and public wage cuts were implemented in mid-2010.
|
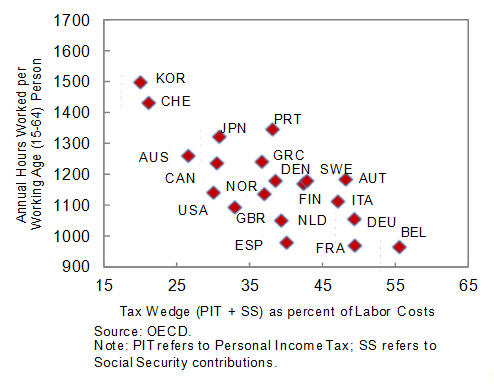
Figure 2. Tax Wedge and Hours Worked per Working-Age Person (2010)
There has also been increased interest in privatization as a source of financing: for example, the Greek authorities have recently announced a plan to raise privatization revenues equivalent to 6½ percent of GDP over two years (cumulative). This is an ambitious goal, but not an unprecedented one: cumulative revenues in excess of 5 percent of annual GDP in a two-year period have been collected in about 20 past episodes in Europe.
Fiscal adjustment in Europe is being accompanied by a strengthening of institutions and rules. Following recent reforms in the United Kingdom (e.g., the introduction of a fiscal council) and Germany (a balanced-budget constitutional rule), initiatives aimed at improving the budget process are being debated in several countries, including France, Greece, Ireland, Italy, and Portugal. A draft European Union Directive under review in the European Parliament addresses weaknesses in national budgetary institutions and procedures that have undermined past efforts to enforce the Stability and Growth Pact (SGP). Such weaknesses include a lack of medium-term orientation, an optimistic bias in official forecasts, the absence of binding national fiscal objectives consistent with the SGP, a lack of transparency in budget data, and poor monitoring and management of fiscal risks arising from tax expenditures, guarantees, and other contingent liabilities. The envisaged deadline for translating the Directive into national legislation is end-2013.
In the United States, the deficit projection for 2011 has been revised significantly downward, as post–April 15 data on revenues have come in stronger (in part because of sizable capital gains in 2010) and expenditures have been more contained than initially projected. As a result, the cyclically-adjusted fiscal deficit in 2011 is no longer seen as imparting fiscal stimulus compared with 2010. Consistently, achieving the previously announced fiscal targets for 2012 will require less abrupt adjustment than earlier projected. To ensure fiscal sustainability, it is urgent that broad political support be forged on a comprehensive and balanced set of specific measures to underpin a credible medium-term fiscal adjustment plan with objectives (e.g., an explicit debt target) endorsed by Congress. Focusing on adjustment measures that reform entitlements, promote efficiency—such as broadening the tax base via the elimination of tax expenditures (see the April 2011 Fiscal Monitor)—and address the growth of current spending in a targeted way would help contain any negative short-term growth impact of fiscal adjustment. In this respect, different policymakers have recently unveiled their own alternative fiscal consolidation blueprints. Both major plans—the President’s April proposal and the House of Representatives’ Republican-sponsored budget resolution—aim for about US$4 trillion in savings over the next 10–12 years. There are, however, significant differences in the proposed policy mix, macroeconomic assumptions, and the budget baseline from which these savings are calculated. The need to raise the debt ceiling in the near term (by early August, according to the U.S. authorities) is serving to focus the negotiations on an initial list of specific consolidation measures. An increase in the debt ceiling is neither avoidable—it would need to be lifted under all proposed plans—nor exceptional, as it has been increased more than 70 times over the past few decades, and 10 times during the last 10 years. Nevertheless, should Congress prove unwilling to raise the debt ceiling, there would be a risk of a major adverse market reaction. Moreover, keeping net debt issuance at zero would require unrealistically large spending cuts during the remainder of this year. Thus, despite the welcome news compared with the April Monitor, the priority remains agreement on a medium-term fiscal adjustment plan.
In Japan, Australia, and New Zealand, recent natural disasters are negatively affecting the fiscal accounts. In Japan, projected deficit/GDP ratios are higher for both 2011 and 2012, owing to weaker output growth and revenues this year and greater reconstruction costs. In addition to the 0.8 percent of GDP supplementary budget approved in May (already included in the April 2011 Fiscal Monitor projections), a further supplementary budget is expected in the second half of 2011 that is projected to increase spending by about 1 percentage point of GDP in 2012. This further weakening of the fiscal accounts makes the definition of a more detailed medium-term fiscal adjustment plan (with tax measures as its centerpiece) even more urgent. In Australia, the budget released in May estimates 2010/11 and 2011/12 deficit figures ½ to ¾ percent of GDP higher than foreseen in the November 2010 Mid-Year Economic and Fiscal Outlook. This reflects lower revenues due to the softer economy (owing in part to natural disasters) and larger than initially estimated losses accumulated during the global financial crisis. In New Zealand, where the damage to the existing capital stock has been the largest as a share of national output, most of the reconstruction costs will be covered by the national disaster fund, offshore reinsurance, and commercial insurance, with the remainder financed by central government borrowing (2¾ percent of 2011 GDP). Despite the earthquakes, the government aims to return to surpluses in 2014/15, one year ahead of its earlier plan.
In emerging and low-income countries, key challenges are to avoid overheating and to address pressing social needs without compromising sustainability
In emerging and low-income economies, fiscal deficits and debts are being reduced gradually. In several of these economies—including commodity producers benefiting from high export prices—the economic recovery has been faster, and the task is to avoid overheating. In Turkey, rapid domestic demand growth is reflected in a widening current account deficit and booming revenues, especially from imports. To the extent that strong revenues may prove transient, they should be saved, also to keep inflation in check. In China, a gradual withdrawal of stimulus is envisaged in this year’s budget. In Poland, expenditure cuts of about 1 percent of GDP are being implemented this year.
In many Latin American economies, the overall fiscal balance is projected to improve in 2011 compared with 2010, but the fiscal position is not particularly strong from an historical perspective (Box 1). The fiscal stance is broadly in line with medium-term-oriented fiscal rules. Other than in Chile, these rules are for the most part not defined in cyclically-adjusted terms. In most cases, more could be done to dampen overheating pressures (Figure 3). In Brazil, where the debt ratio remains high by emerging market standards, fiscal outturns through April indicate that stimulus withdrawal is on track to meet the 3 percent of GDP primary surplus target in 2011, while treasury lending to Brazil’s National Development Bank is being reduced. A slight downward revision to the overall balance largely reflects a higher projected interest bill. In Mexico, fiscal consolidation is underway, driven by spending restraint and stronger revenues stemming from solid economic growth and high oil prices; from 2012 onward, compliance with the balanced-budget rule would ensure that the public debt/GDP ratio is gradually reduced. In Colombia, the government is expected to increase spending on infrastructure and reconstruction projects after major floods last year, which will be offset by higher tax revenues as growth remains firm. Meanwhile, the establishment of a fiscal rule is currently under discussion in Congress. In Peru, the fiscal deficit is expected to stay in line with the 0.5 percent of GDP target under the fiscal responsibility law. Overall, as revenues remain buoyant and inflation expectations continue rising, these countries would benefit from over-performing with respect to their fiscal goals to help contain domestic demand pressures and increase fiscal savings. This is especially true given that revenue gains associated with strong capital inflows and commodity prices could prove temporary. Consideration should be given to redefining fiscal rules on cyclically-adjusted targets, to discourage pro-cyclicality of fiscal policies.
Figure 3. Improvement in the Structural Primary Balance
(In percent of GDP)

For many emerging and low-income economies, the adverse fiscal impact of high fuel and food prices is expected to be sizable. For example, spending overruns seem likely in India, based on rapid growth in fuel and food subsidies during the past few quarters. Indeed, consistent with these observations, projections for the 2012 deficit have been revised upward compared with the April 2011 Fiscal Monitor. India’s fiscal deficit is projected to fall gradually in the coming years, but will remain high. Its debt ratio will decline moderately, mainly due to rapid output growth.
|
Box 1. Fiscal Developments in Historical Perspective in Latin America
While most countries in Latin America have weathered the storm of the global financial crisis, their fiscal position is not particularly strong from an historical perspective nor when compared to other emerging economies. Many countries in the region need to reduce deficits more rapidly and to reorient spending, in order to protect against a sudden reversal of favorable tailwinds and to make room for priority spending.

The fiscal position of Latin American economies is expected to strengthen in 2011, with overall deficits falling to an average of 2½ percent of GDP and debt to about 50 percent of GDP. However, this debt ratio is not much different from its 1980–2010 average; it is also higher than in the mid-1990s, although for many countries vulnerabilities may have declined since then, owing to better debt structures by currency and maturity. Similarly, relative to the position of other emerging economies, overall balances in Latin America are somewhat better, but debt levels are above those of emerging Asia and emerging Europe.
A more cautious fiscal policy stance is warranted in the face of ongoing global risks and prospective spending challenges. Revenue performance in some cases has been supported by favorable tailwinds, such as high commodity prices and capital inflows, which could be short-lived. The global low interest rate environment has also helped to contain countries’ interest burdens. In addition, Latin American countries must intensify investment in infrastructure and respond to demographic spending pressures—as health care and pension costs are projected to rise by an estimated 3 percent of GDP on average over the next 20 years, and 7½ percent over the next 40 years. Furthermore, while financial market conditions have improved, large capital inflows and easy credit conditions pose risks to the financial system (through rapid credit growth and excessive risk taking) with potential implications for the budget. |
Beyond the continued impact of high fuel and food prices, political turmoil in the Middle East and North Africa has taken a toll on economic activity and revenues. Governments have responded with measures such as expansion of subsidies, civil service wage and pension increases, additional cash transfers, and tax reductions. The scale of these measures has ranged from near-negligible to several percentage points of GDP, with a tendency to be larger in oil-rich countries than in oil importers. The largest measures have been undertaken in Saudi Arabia, where the February/March 2011 fiscal packages (if fully implemented) are estimated to total about 19 percent of GDP. Of this, an estimated 5½ percent of GDP would be spent in 2011. Capital expenditures, which constitute two thirds of the packages, are expected to spread over several years. In Egypt, where the authorities have recently requested financial assistance from the IMF, revenues have fallen while subsidies and social spending have increased substantially. Going forward, an important policy objective will be to stabilize and gradually reduce the debt/GDP ratio, while shifting spending toward social programs. More generally, recent events in the region have given renewed urgency to the need to counter joblessness, particularly among young people. Depending on country-specific circumstances and in the context of broader economic and labor market reforms, viable labor-intensive infrastructure projects and means-tested transfers to protect the most vulnerable could help in this regard. Measures to enhance non-oil revenue mobilization will also be needed.
Government bond markets have remained broadly stable, but pressures on some European economies have intensified
Despite political events in the Middle East and North Africa, natural disasters, and the announcement in April of Standard and Poor’s negative outlook for the sovereign credit ratings of the United States and Japan, government bond yields in the largest advanced economies remain at very low levels, providing little incentive to reduce deficits (Figure 4; see also Global Financial Stability Report Update, June 2011). The announcement of negative outlooks for Belgium and Italy in May had a somewhat larger impact, but credit default swap (CDS) spreads later returned to their previous levels. Likewise, emerging economies’ spreads have been stable.
Figure 4. Recent Developments in Sovereign Bond Markets
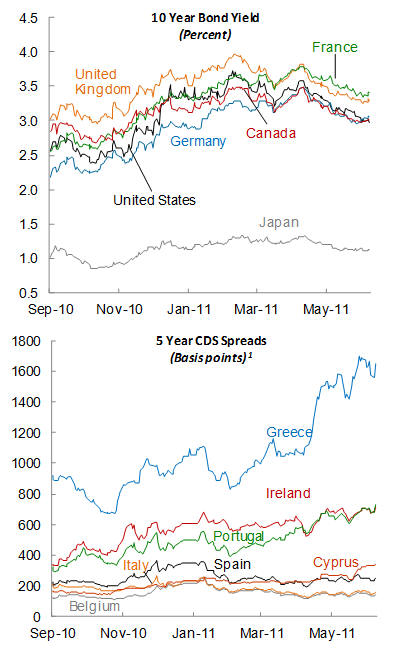

In contrast, market concerns about debt sustainability remain acute in Greece, where spreads have risen by 600 basis points since end-2010, to almost 1,700 basis points in early June. In Ireland and Portugal spreads have risen by 100–230 basis points to reach more than 700 basis points. In these cases, heightened concern regarding public debt dynamics has become more evident as there have been no further secondary market purchases by the European Central Bank (ECB). Meanwhile, risk perceptions have worsened notably for Cyprus.
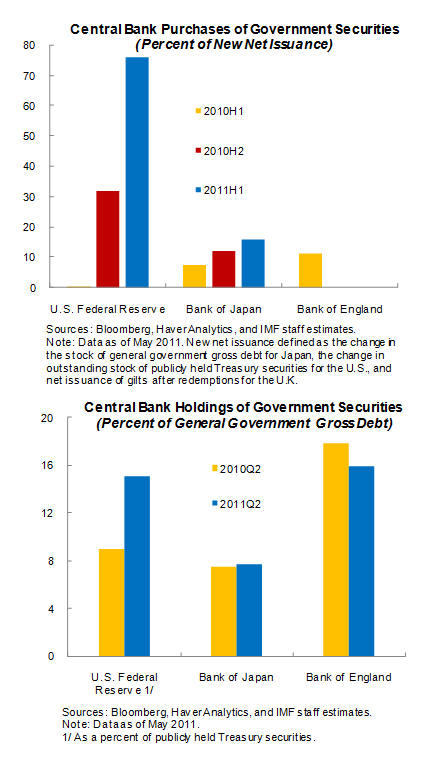
Figure 5. Central Bank Purchases of Government Securities
Contagion to other Euro-area countries has been more limited, with spreads broadly stable in Belgium, Italy, and Spain. Despite ongoing fiscal consolidation, however, spreads remain in the 140–260 basis points range for these countries. In contrast, spreads for some Baltic and eastern European countries have declined—in Latvia, Lithuania, and Romania by 50–70 basis points since early 2011 (to about 200 basis points)—a sign of greater market confidence as fiscal reform advances and growth performance improves.
Some central banks in the largest advanced economies have continued purchasing government securities as announced, acquiring a significant share of government debt. Purchases of government bonds by the U.S. Federal Reserve since end-2010 have amounted to US$500 billion—with total envisaged asset purchases of US$600 billion under the second round of quantitative easing slated to end in June—bringing its holdings to 15 percent of publicly-held government debt. Securities purchases by the Bank of Japan (BOJ) are continuing. The BOJ now holds 7½ percent of outstanding government debt. Meanwhile, there have been no further market interventions by the ECB since March; its holdings of government securities remain equivalent to 11 percent of the outstanding debt of Greece, Ireland, and Portugal. In contrast, the Bank of England essentially halted its net purchases of government debt about a year ago, though its stock of holdings still stands at 16 percent of outstanding U.K. sovereign debt. Although unwinding these large portfolios of government debt could present challenges in an environment of still-sizable sovereign financing requirements, central banks may well opt to hold to maturity a substantial portion of their government debt holdings.
|