
Foreign exchange trader in Tokyo, Japan: data reported to IMF suggest more active reserves management generally (photo: Yuriko Nakao/Reuters)
TRENDS IN INTERNATIONAL RESERVES
Data reported to the IMF by industrial and developing (nonindustrial) countries, compiled on an aggregate basis in the IMF's Currency Composition of Official Foreign Exchange Reserves (COFER) database, reveal that more developing countries than industrial countries have switched holdings into euros. Nonindustrial countries hold some 30 percent of their reserve assets in euros and 60 percent in dollars (as of December 2006), compared with 19 percent and 70 percent, respectively, six years earlier.
Rising use of euro
Industrial countries' use of the euro has risen to 21 percent from 17 percent in December 2000, while their dollar holdings have remained fairly steady at 72 percent compared with nearly 73 percent six years earlier. Their remaining holdings are in such currencies as the Japanese yen and the pound sterling.
Currently, 120 IMF member countries, comprising 25 industrial countries and 95 developing ones, voluntarily report COFER data to the IMF. Individual countries' currency compositions are confidential.
Separately, the IMF has compiled data reported by 58 industrial and nonindustrial countries and the European Central Bank (referred to hereafter as "the reporting economies") through the IMF data template on international reserves and foreign currency liquidity, from which trends between December 2000 and December 2006 could also be compared.
Although not all countries report the template data to the IMF for publication on the IMF's website, the database appears to be globally representative, accounting for 62 percent of the world's reserve holdings.
Reserves growing rapidly
As a share of their aggregate GDP, the reporting economies' reserves grew from 5 percent in December 2000 to 8 percent in December 2006. Their liquidity ratio—defined as international reserves and other official liquid foreign currency assets relative to official short-term foreign currency liabilities—collectively rose from approximately 8 in December 2000 to about 17 in December 2006, the result of a substantial increase in foreign currency reserves and a moderate decline in official short-term foreign currency debt.
Where do the data on liquidity come from?
Following the 1997 Asian crisis, the IMF and the Bank for International Settlements jointly developed a data template on international reserves and foreign currency liquidity.
Subscribers to the IMF Special Data Dissemination Standard are required to publish the liquidity template data; they are also encouraged to report the data to the IMF for publication on the IMF website.
By last December, the market value of the reserve assets of the reporting economies was about $3.27 trillion (54 percent accounted for by industrial reporting economies and 46 percent by nonindustrial reporting economies), compared with about $1.4 trillion held in December 2000 (71 percent accounted by industrial reporting economies and 29 percent by nonindustrial reporting economies).
The rise in the value of reserve assets was largely accounted for by the increase in the market value of securities among the economies' international reserves. In December 2006, securities accounted for 66 percent of the market value of reserve assets of the reporting economies; bank deposits, 19 percent; gold, 10 percent; other reserve assets, 4 percent; and IMF reserve positions and Special Drawing Rights (the SDR is an international reserve asset created by the IMF in 1969 to supplement members' existing official reserves), 1 percent.
Liquidity on the rise
The rise in liquidity was most pronounced for nonindustrial economies. Their aggregate liquidity ratio reached 37 in December 2006, up from about 5.5 in December 2000. Among these economies, liquidity increased particularly for the Asian export-oriented economies, which accumulated sizable foreign currency reserves while minimizing short-term official foreign currency liabilities.
As for industrial economies other than those in the euro area, moderate increases in reserve assets and slight declines in external short-term foreign currency liabilities raised their aggregate liquidity ratio from about 11 to about 12.5 during the same period. The liquidity positions of the euro area also increased moderately, from 8.6 to about 10.5.
The data of the reporting economies show that, in managing their reserves, central banks increasingly used financial derivatives, repurchase agreements (repos), and pooling arrangements. Central banks' use of financial derivatives, repos, gold swaps, securities lending, nondeliverable forwards, and other financial instruments, as disclosed in the liquidity data reported to the IMF, further reveals the increased complexity of reserves management and the linkage of reserves and debt management. The increased use of complex financial instruments also suggests rising investment in riskier assets, greater efforts needed in managing risks, and more active reserves management generally.
Securities still popular
Industrial economies other than those in the euro area (see chart) invest most of their reserve assets in securities such as U.S. treasury bonds—about 75 percent in December 2006 compared with 65 percent in December 2000. Increases in liquidity allow reserves managers in these countries to invest more in securities as they aim to realize higher returns.
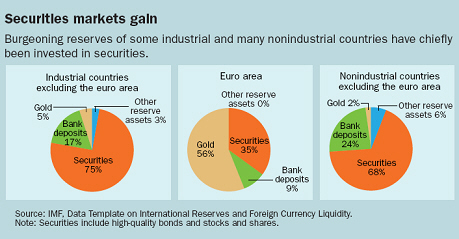
The share of securities among reserve assets has risen in these countries as the shares of bank deposits and gold have declined. For these countries, bank deposits account for about 17 percent of the reserve assets, and gold, only about 5 percent.
The composition of the euro area's reserve assets differs from that of other economies. Recently, gold has represented about 56 percent of the reserve assets of the euro area (compared with about 30 percent in December 2000), largely as a result of rising gold prices. The increasing share of gold among reserve assets in these countries is accompanied by the noticeable decline in the share of securities (recently accounting for about 35 percent of reserve assets). The share of bank deposits has increased slightly in recent years, to about 9 percent; that of other reserve assets has remained insignificant.
Approximately 68 percent of the reserve assets of nonindustrial economies are invested in securities, about 24 percent in bank deposits, and 2 percent in gold. It appears that, while searching for higher returns, reserves managers in these countries have maintained their focus on the liquidity and security offered by bank deposits.
Rise of "other reserve assets"
One shift in the composition of reserve assets for this group of nonindustrial economies is evident in the rising share of "other reserve assets," which reached about 6 percent recently compared with about 2 percent in December 2000. "Other reserve assets" are assets other than securities, bank deposits, and gold.
One major reason for this shift could be the development of the Asian Bond Funds (ABFs), to which a number of Asian nonindustrial economies contribute to develop a regional bond market. The ABFs have been recorded as "other reserve assets" in the data reported to the IMF.
The aggregate data for the reporting industrial and nonindustrial economies also show that they hold another $50 billion of other foreign currency assets—assets not included in reserves, possibly including some of the reporting economies' petroleum funds and other special-purpose funds.
The reporting economies generally do not report data for sovereign wealth funds (SWFs). Estimates for global SWFs are in the range of $1.5 trillion to $2.5 trillion. If countries are asked to report SWFs, the data template could be used to do so.