Chart of the Week: Inequality in China
IMF Blog, September 20, 2018
Source details
- Canonical URL
- Chart of the Week: Inequality in China
Other formats
Bibliographic details
- Authors: Sonali Jain-Chandra
- Published: September 20, 2018
Overview and key statistic
- Author: Sonali Jain-Chandra
- Date: September 20, 2018
- Caption: A gardener outside a luxury auto showroom in Beijing. China has moved from being moderately unequal in 1990 to being one of the world’s most unequal countries (photo: Stephen Shaver/UPI/Newscom)
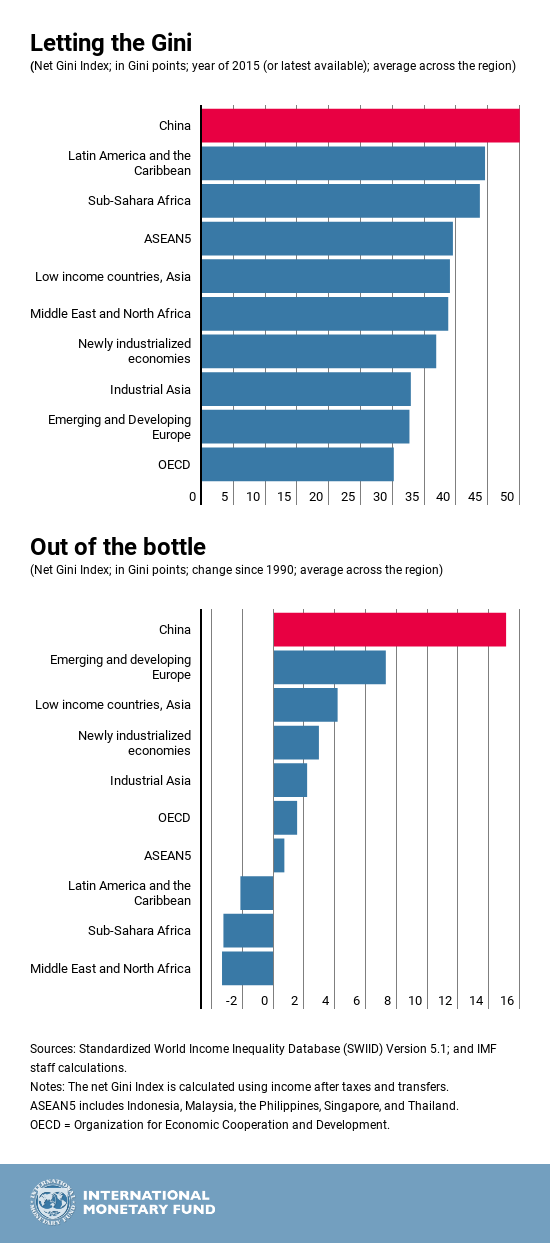
- The Gini coefficient has risen by 15 points since 1990 to 50. (A reading of zero would indicate that everyone has the same income, while a reading of 100 would mean that the richest person gets all the income.)
Main findings
- More than two decades of spectacular economic growth in China have raised incomes dramatically and lifted millions out of poverty.
- Growth hasn’t benefited all segments of the population equally; China moved from being moderately unequal in 1990 to being one of the world’s most unequal countries.
- Inequality has leveled off and even declined slightly since 2008, reflecting policy measures undertaken by the government.
- Without additional policy changes, inequality is likely to rise further.
Drivers of rising inequality
- Differences in education: Rapid technological change and industrialization have boosted demand, and therefore incomes, for highly skilled workers.
- Urban–rural income differences: Educational attainment is lower in rural areas, and China’s hukou system of household registration limits migration to urban areas, where wages are higher.
Policies China has implemented to limit inequality
- Raised the minimum wage.
- Raised the minimum threshold for income taxes multiple times.
- Abolished agricultural taxes.
- Improved public services and social protection in the countryside.
Policy recommendations and options to reduce future inequality
- Rely more on the personal income tax and less on regressive consumption taxes.
- Make the design of personal income taxes and social security taxes more progressive.
- Further increase spending on social services, especially in rural areas, to reduce inequality.
Chart of the Week: Inequality in China — IMF blog post by Sonali Jain-Chandra, September 20, 2018.
Content in this bundle
- 本周图表:中国的不平等状况; IMF blog; 2018年9月20日
- 今週のグラフ: 中国における格差: ソナリ・ジェイン=チャンドラ著、IMFブログ, 2018年9月20日
References
- https://www.imf.org/wp-content/uploads/2018/09/BLOG-1024x600-China-Gardner-outside-luxury-showroom-Shaver-UPI-Newscom-Chinaupiphotostwo335851.jpg
- https://www.imf.org/wp-content/uploads/2018/09/eng-august-30-china-inequality-3.png
- Chart of the Week: China’s Thrift, and What to Do About It
- China’s Economic Outlook in Six Charts
- 5 Things You Need to Know About Inequality