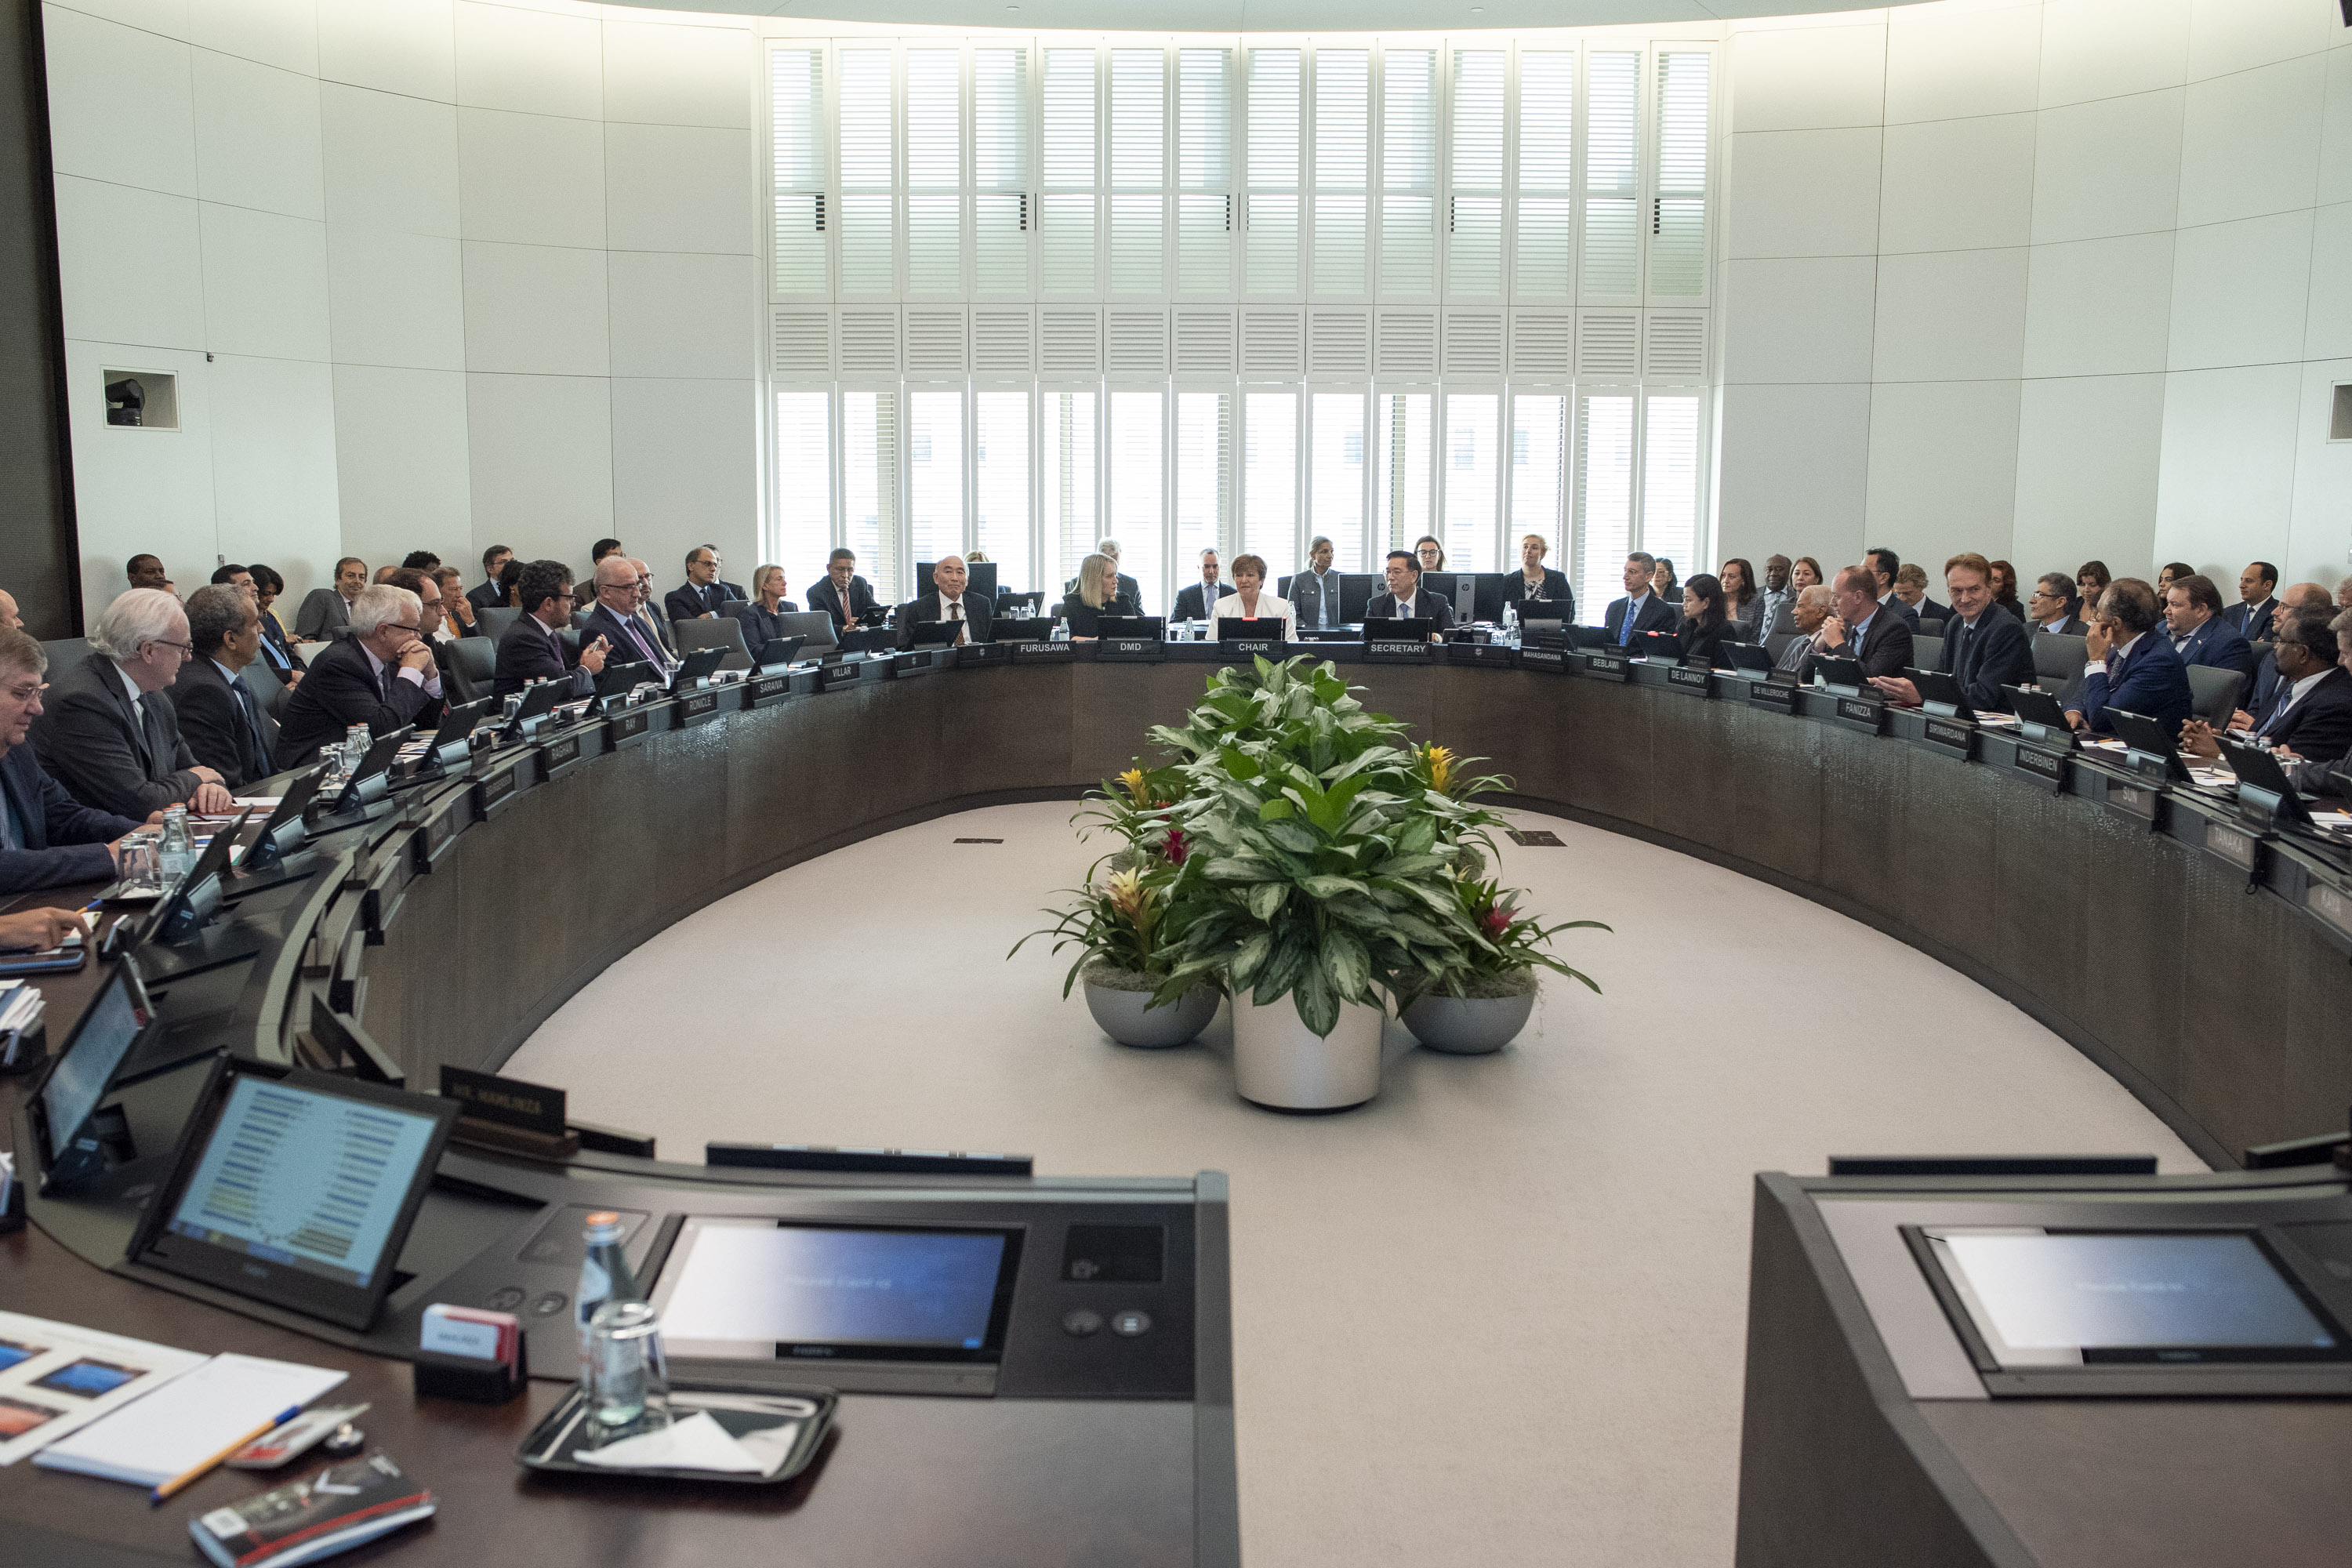
IMF Executive Board Completes Tenth Review under the Extended Credit Facility Arrangement for Mali and approves US$43.85 Million Disbursement
IMF News, December 10, 2018
Source details
- Canonical URL
- IMF Executive Board Completes Tenth Review under the Extended Credit Facility Arrangement for Mali and approves US$43.85 Million Disbursement
Other formats
Bibliographic details
- Published: December 10, 2018
Review completion and disbursement
- On December 10, 2018, the Executive Board completed the Tenth Review of Mali’s performance under an Extended Credit Facility (ECF) arrangement.
- Completion of the review enables immediate disbursement of SDR 31.65 million (about US$43.85 million).
- Total disbursements under the arrangement following this review: SDR 186.6 million (about US$ 258.53 million) or 100 percent of quota.
- Original ECF approval: SDR 30 million (about US$46.2 million, or 32 percent of quota) on December 18, 2013.
- Additional access: SDR 68 million (about US$94.21 million), approved on June 9, 2016.
- Augmentation and one-year extension: SDR 88.6 million (about US$122.75 million), approved on July 7, 2017, bringing total access to SDR 186.6 million (about US$258.53 million) or 100 percent of quota.
Program performance and macroeconomic outlook
- Statement by Mr. Mitsuhiro Furusawa, Deputy Managing Director and Acting Chair:
- “Mali’s economic performance over the course of the ECF‑supported program has been broadly positive. Macroeconomic stability has been restored under difficult circumstances marked by persistent insecurity, volatile commodity prices, and adverse weather conditions. While the ECF‑supported program catalyzed financing from international donors, the authorities’ reforms over the last five years helped create the foundations for solid growth and subdued inflation. However, meaningfully reducing poverty has remained a challenge.”
- “Program implementation was broadly on track at end‑June 2018, although progress on structural reforms has been slower than expected. The authorities are taking important steps to address the tax revenue shortfall in 2018, including through intensified revenue collection and spending cuts.”
- “The near‑term macroeconomic outlook remains favorable, although there are considerable downside risks from the fragile security conditions, commodity prices changes, and weather conditions.”
- “The 2019 draft budget provides an adequate basis for fiscal policy and reflects the authorities’ commitment to meeting the WAEMU fiscal deficit target. Pursuing ambitious fiscal reforms going forward would help address emerging fiscal risks and make room for needed security, social and capital spending, while maintaining a sustainable deficit. Steadfast efforts to improve public finance and debt management would also boost the policy framework.”
- “To build upon and sustain the progress achieved, the authorities should pursue the structural reforms set in motion during the program to promote private activity, economic diversification, and foster sustained, inclusive growth.”
Policy actions and recommendations
- Address the 2018 tax revenue shortfall through:
- Intensified revenue collection.
- Spending cuts.
- Pursue ambitious fiscal reforms to:
- Address emerging fiscal risks.
- Make room for security, social, and capital spending while maintaining a sustainable deficit.
- Strengthen public finance and debt management.
- Continue structural reforms to:
- Promote private activity.
- Support economic diversification.
- Foster sustained, inclusive growth.
Key statistics and projections (from Table 1: Mali: Selected Economic and Financial Indicators, 2013–23)
- Real GDP (annual change, percent): 2013: 2.3; 2014: 7.1; 2015: 6.2; 2016: 5.8; 2017: 5.3; 2018: 5.4; 2019 (Prog.1): 5.0; 2020 (Rev. Prog.): 4.9; 2021 (Proj.): 4.7; 2022 (Proj.): 4.8.
- GDP deflator (annual change, percent): 2013: 0.6; 2014: 1.3; 2015: 2.9; 2016: 1.4; 2017: 1.2; 2018: 2.0; 2019: 1.9; 2020: 2.1; 2021: 2.2.
- Consumer price inflation (average, percent): 2013: -2.4; 2014: 2.7; 2015: -1.8; 2016: 0.2; 2017: 1.8; 2018: 1.7.
- Consumer price inflation (end of period, percent): 2013: 0.0; 2014: 1.0; 2015: -0.8; 2016: 1.1; 2017: 1.6.
- Terms of trade (deterioration -, percent change): 2013: -16.6; 2014: 5.5; 2015: 18.6; 2016: 15.5; 2017: -6.4; 2018: -1.3; 2019: -2.6; 2020: -4.9; 2021: 0.9; 2022: -3.1; 2023: -0.2; (additional years) 0.7.
- Real effective exchange rate (depreciation -, percent change): 2013: 0.5; 2014: -3.5; 2015: -1.9.
- Credit to the government (contribution to broad money growth, percent): 2013: -2.7; 2014: 0.8; 2015: 10.4; 2016: 6.9; 2017: 3.9; 2018: 14.5; 2019: 7.4; 2020: 3.0.
- Credit to the economy (contribution to broad money growth, percent): 2013: 7.5; 2014: 12.4; 2015: 14.6; 2016: 13.7; 2017: 10.8; 2018: 6.3; 2019: 8.5; 2020: 8.9; 2021: 9.8.
- Broad money (M2, percent change): 2013: 13.2; 2014: 7.3; 2015: 7.8; 2016: 7.9; 2017: 16.2; 2018: 7.0; 2019: 8.0.
- Gross domestic investment (percent of GDP): 2013: 19.3; 2014: 20.2; 2015: 20.8; 2016: 22.7; 2017: 20.0; 2018: 22.1; 2019: 19.6; 2020: 20.6; 2021: 19.7; 2022: 20.9; 2023: 21.6; (additional years) 21.7; 21.8.
- Gross national savings (percent of GDP): 2013: 16.4; 2014: 15.4; 2015: 11.8; 2016: 13.0; 2017: 13.4; 2018: 13.6; 2019: 14.2; 2020: 14.8; 2021: 15.0.
- Gross domestic savings (percent of GDP): 2013: 4.3; 2014: 4.6; 2015: 4.2; 2016: 4.1; 2017: 5.7; 2018: 10.2.
- Central government finance — Revenue (percent of GDP): 2013: 14.9; 2014: 16.7; 2015: 18.3; 2016: 18.4; 2017: 19.4; 2018: 17.9; 2019: 18.7; 2020: 18.5; 2021: 19.1; 2022: 19.9.
- Central government finance — Grants (percent of GDP): 2013: 2.8.
- Central government finance — Total expenditure and net lending (percent of GDP): 2013: 19.8; 2014: 22.3; 2015: 24.0; 2016: 22.9; 2017: 23.9; 2018: 23.3; 2019: 23.5; 2020: 24.1; 2021: 24.4; 2022: 24.6; 2023: 24.9.
- Overall balance (payment order basis, including grants, percent of GDP): 2013: -2.9; 2014: -3.9; 2015: -3.3; 2016: -3.0.
- Overall balance (cash basis, including grants, percent of GDP): 2013: -3.2; 2014: -3.4; 2015: -3.6.
- Basic fiscal balance (WAEMU definition, percent of GDP): 2013: -0.7; 2014: -1.2; 2015: -1.1; 2016: -0.9.
- Current external balance, including official transfers (percent of GDP): 2013: -4.7; 2014: -5.3; 2015: -7.2; 2016: -8.1; 2017: -5.9; 2018: -6.5; 2019: -7.4; 2020: -6.3; 2021: -7.0; 2022: -6.8.
- Current external balance, excluding official transfers (percent of GDP): 2013: -12.4; 2014: -12.7; 2015: -12.3; 2016: -14.6; 2017: -13.0; 2018: -13.6; 2019: -14.2; 2020: -13.5; 2021: -14.4; 2022: -13.9; 2023: -13.4; (additional years) -8.8.
- Exports of goods and services (percent of GDP): 2013: 22.6; 2014: 23.1; 2015: 21.1; 2016: 21.5; 2017: 18.9; 2018: 18.0; 2019: 17.2.
- Imports of goods and services (percent of GDP): 2013: 39.9; 2014: 38.1; 2015: 39.6; 2016: 40.3; 2017: 41.2; 2018: 38.9; 2019: 38.0; 2020: 36.7; 2021: 35.3; 2022: 34.0; 2023: 28.8.
- Debt service to exports of goods and services (percent): 2013: 3.8; 2014: 5.9; 2015: 6.6.
- External debt (end period, percent of GDP): 2013: 25.0; 2014: 25.3; 2015: 23.4; 2016: 24.8; 2017: 23.2; 2018: 24.2; 2019: 23.8.
- Nominal GDP (CFAF billions): 2013: 6,541; 2014: 7,093; 2015: 7,748; 2016: 8,308; 2017: 8,868; 2018: 8,929; 2019: 9,474; 2020: 9,557; 2021: 10,057; 2022: 10,221; 2023: 10,950; (additional years) 11,727; 12,564; 13,460.
- WAEMU gross official reserves (billions of US$): 2018 (end-September): 13.8; 13.3; 12.5; 10.5; 15.1.
- WAEMU gross official reserves (percent of broad money): 49.9; 47.2; 44.0.
- WAEMU gross official reserves (months of WAEMU imports of GNFS): 4.5.
- Public Debt (percent of GDP): 2013: 26.4; 2014: 27.4; 2015: 30.7; 2016: 35.9; 2017: 31.8; 2018: 35.4; 2019: 37.3; 2020: 36.6; 2021: 37.5; 2022: 38.7; 2023: 39.3; (additional year) 39.5.
- Domestic debt (end period, percent of GDP) 3: 11.0; 14.1; 15.8.
- US$ exchange rate (end of period): 478.7; 532.0; 603.1; 622.2; 554.2.
- Gold Price (US$/fine ounce London fix): 1411; 1266; 1160; 1248; 1254; 1257; 1340; 1261; 1375; 1218; 1255; 1304; 1343; 1382.
- Petroleum price (crude spot)(US$/bbl): 104; 96; 51; 43; 55; 53; 62; 69; 58; 66; 63; 61; 60.
Sources cited in the original table: Ministry of Finance; and IMF staff estimates and projections. Notes from the table:
- 1 IMF Country Report No. 17/209, Mali: Seventh Review Under the Extended Credit Facility Arrangement.
- 2 Total revenue, plus general budgetary grants, plus revenue from HIPC debt relief, minus total expenditure and net lending excluding foreign-financed capital spending.
- 3 Includes BCEAO statutory advances, government bonds, treasury bills, and other debts.
- 4 Values for 2018 are for end-September 2018. All other years are end-December.
IMF Press Release No. 18/464, December 10, 2018.