New Data on World Debt: A Dive into Country Numbers
IMF Blog, December 17, 2019
Source details
- Canonical URL
- New Data on World Debt: A Dive into Country Numbers
Other formats
Bibliographic details
- Authors: Marialuz Moreno Badia, Paolo Dudine
- Published: December 17, 2019
Overview
- Total global debt (public plus private) reached US$188 trillion at the end of 2018, up by US$3 trillion when compared to 2017.
- The global average debt-to-GDP ratio (weighted by each country’s GDP) edged up to 226 percent in 2018, 1½ percentage points above the previous year.
- Although the 2018 annual increase was the smallest in the global debt ratio since 2004, country-level data reveal rising vulnerabilities that suggest many countries may be ill-prepared for the next downturn.
No big changes in 2018
- The reduction in the global debt ratio in 2017 did not mark the beginning of a declining trend; in 2018 the global debt ratio rose only slightly above the level in 2016.
- Two distinct groups in overall trends:
- Advanced economies: The debt ratio for both the public and private sectors declined in the majority of countries in 2018. Half of advanced economies ran fiscal surpluses in 2018; a third shrank the fiscal deficit or increased the fiscal surplus compared with the previous year. Changes in the average total debt ratio for the group were relatively small, declining 0.9 percent of GDP.
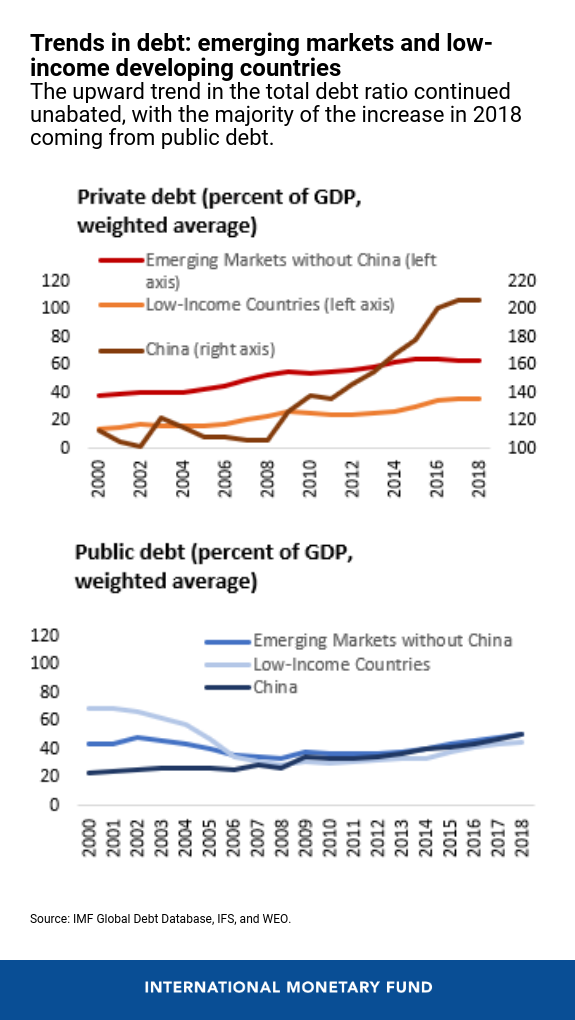
- Emerging markets and low-income developing countries: The upward trend in the total debt ratio continued, with the main increase coming from public debt. The average public debt ratio increased by more than 2½ percentage points in sub-Saharan Africa.
Advanced economies — patterns and sectoral shifts
- Advanced-economy average total debt ratio: 265 percent (context: China reached 258 percent; United States at 258 percent).
- Public debt:
- Public debt ratios are high by historical standards in most countries.
- Public debt ratios are higher than before 2008 in almost 90 percent of advanced economies.
- In a third of advanced economies, the public debt ratio is 30 percentage points above the pre-crisis level.
- Private debt:
- Corporate debt ratio in advanced economies has gradually increased since 2010 and is now at the same level as in 2008.
- Country differences: Spain and the United Kingdom saw large corporate deleveraging since the global financial crisis; the United States saw corporate debt grow consistently since 2011 and reach a record high at the end of 2018.
- Growing use of debt for financial risk-taking (dividends, share buybacks, mergers and acquisitions) and higher speculative-grade debt could amplify shocks if defaults occur or firms cut investment or employment.
- Household debt ratios declined in advanced economies as a whole compared to 2008, with large decreases in the United States and the United Kingdom and increases in one third of advanced economies.
Emerging markets and low-income developing countries
- Average public debt ratios have risen to levels comparable to those prevailing during the crises of the mid-1980s and 1990s.
- Public debt ratios are above 70 percent in almost a fifth of countries.
- Low-income developing countries: steady build-up of public debt, with two-fifths of them worldwide at high risk of, or in, debt distress.
- Corporate debt in emerging markets (excluding China) has declined since 2015 and is now 4½ percentage points above 2009, but corporate credit quality has worsened in some cases.
- Household debt in emerging markets has been increasing steadily but remains half the level in advanced economies.
China
- China’s total debt ratio reached 258 percent of GDP at end-2018.
- In 2018 China continued efforts to rein in corporate debt: corporate debt declined, sovereign debt increased sizeably, and household debt kept rising.
- China’s prior decade of rising corporate debt contributed more than half of the rise in corporate debt worldwide.
Increasing vulnerabilities and interaction between private and public debt
- Risks are not solely concentrated in the private sector but also in the public sector, reflecting unresolved legacies of the global financial crisis.
- Excessive private debt increases vulnerability to shocks and could lead to abrupt and costly private-sector deleveraging; reducing private-sector debt may place additional burdens on already overindebted public sectors via lower revenues from output declines or losses triggered by corporate defaults.
- The October 2016 Fiscal Monitor is referenced for discussion of these dynamics and the importance of reducing such vulnerabilities before the next adverse shock.
Key statistics (preserved exactly as reported)
- US$188 trillion — total global debt at end-2018.
- US$3 trillion — increase in global debt from 2017 to 2018.
- 226 percent — global average debt-to-GDP ratio in 2018 (weighted).
- 1½ percentage points — increase in the global average debt-to-GDP ratio from 2017 to 2018.
- 258 percent — China’s total debt ratio at end-2018.
- 258 percent — United States total debt ratio at end-2018.
- 265 percent — average total debt ratio for advanced economies.
- 0.9 percent of GDP — decline in average total debt ratio for advanced economies (group aggregate).
- More than 2½ percentage points — increase in the average public debt ratio in sub-Saharan Africa.
- Almost 90 percent — share of advanced economies with public debt ratios higher than before 2008.
- 30 percentage points — amount by which public debt ratio exceeds pre-crisis level in a third of advanced economies.
- Above 70 percent — public debt ratio threshold exceeded in almost a fifth of countries.
- Two-fifths — share of low-income developing countries at high risk of, or in, debt distress.
- 4½ percentage points — amount by which emerging markets’ average corporate debt ratio exceeds 2009.
- Half the level — household debt in emerging markets relative to advanced economies.
Source: New Data on World Debt: A Dive into Country Numbers — Marialuz Moreno Badia, Paolo Dudine; December 17, 2019.
References
- Español,
- Português
- Global Debt Database
- last blog
- https://www.imf.org/wp-content/uploads/2019/12/eng-dec-9-globaldebt.png
- https://www.imf.org/wp-content/uploads/2019/12/eng-dec-9-gdd2.png
- https://www.imf.org/wp-content/uploads/2019/12/eng-dec-9-gdd3.png
- low-income developing countries
- high speculative-grade debt
- October 2016 Fiscal Monitor