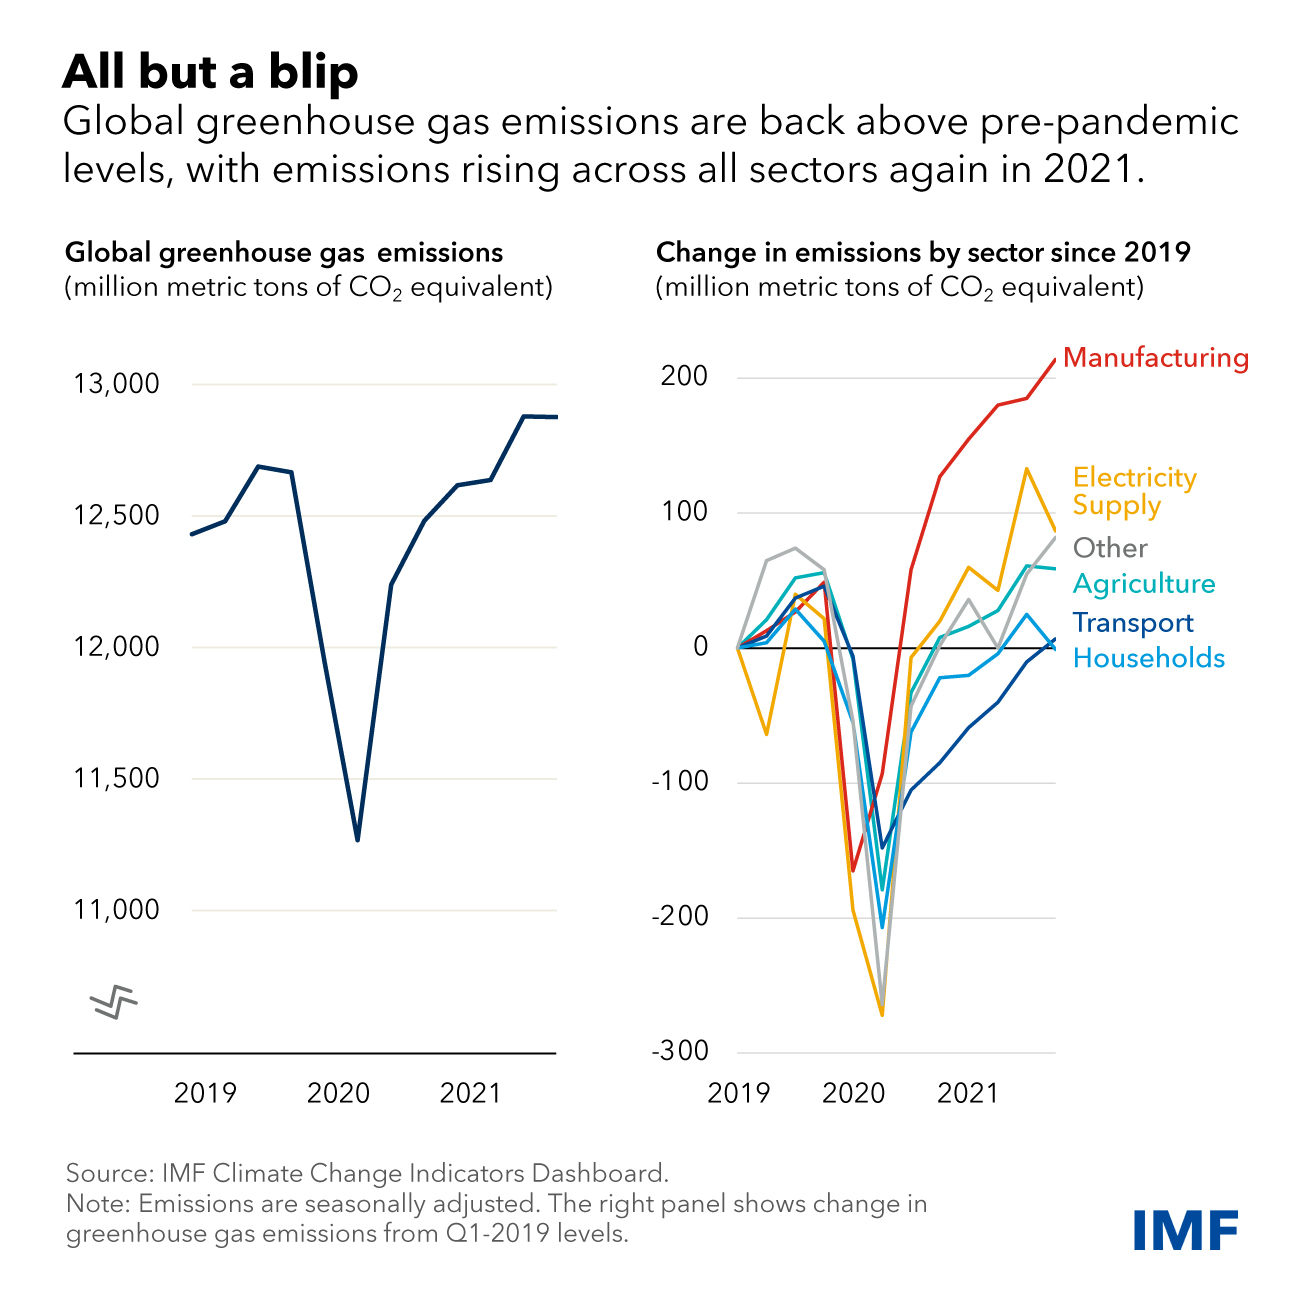
Emissions of carbon dioxide and other greenhouse gases plunged 4.6 percent in 2020, as lockdowns in the first half of the year restricted global mobility and hampered economic activity. Many hoped that this would mark the beginning of a more permanent shift downwards in emissions.
The latest data, however, dashed those hopes. As the Chart of the Week shows, annual global greenhouse gas emissions rebounded 6.4 percent last year to a new record, eclipsing the pre-pandemic peak as global economic activity resumed.
Emissions from the manufacturing and the energy sectors contributed the most to recent global increases based on updated information from the IMF’s Climate Change Indicators Dashboard—a joint effort among national and international statistical organizations to provide timely data to help monitor the transition to lower carbon use.
While total emissions have climbed significantly above pre-pandemic levels, increases from transportation and households were more muted last year as the pandemic weighed on global mobility.
This was particularly evident with the emergence of the omicron variant in the fourth quarter of last year. The public health policy measures in many countries drove down the emissions of households and of the electricity sector.
It will be important to monitor the emissions of both of these sectors as economies fully reopen in the context of historically high fossil fuel-based energy prices.
The Intergovernmental Panel on Climate Change has said that, in the scenarios they assessed, limiting atmospheric warming to the key level of around 1.5 degrees Celsius requires global greenhouse gas emissions to peak by 2025 at the latest.
The new data from the climate dashboard underscore what some scientists have warned: time is running out.


