G20 Quarterly GDP in volume terms
Percentage change on the previous quarter, seasonally adjusted data
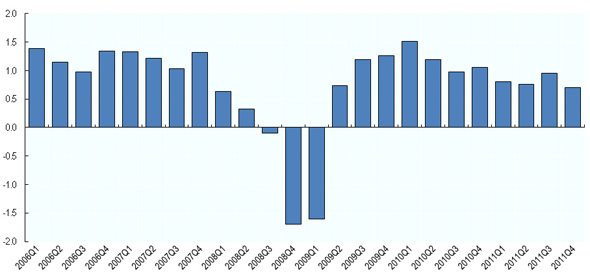 Quarterly GDP in volume terms for the G20
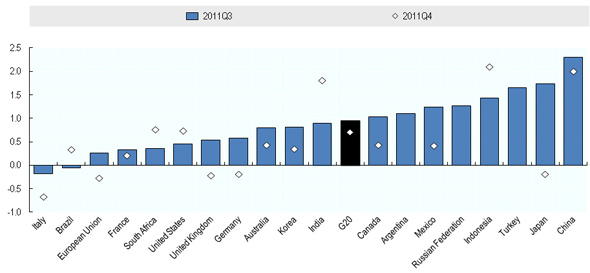
Percentage change on the previous quarter, seasonally adjusted data
|
|
2009Q1 |
2009Q2 |
2009Q3 |
2009Q4 |
2010Q1 |
2010Q2 |
2010Q3 |
2010Q4 |
2011Q1 |
2011Q2 |
2011Q3 |
2011Q4 |
|
Argentina |
-0.9 |
0.4 |
0.4 |
2.3 |
3.6 |
2.9 |
0.6 |
3.0 |
3.2 |
2.4 |
1.1 |
.. |
|
Australia |
0.8 |
0.1 |
0.8 |
0.8 |
0.7 |
0.6 |
0.3 |
0.6 |
-0.3 |
1.4 |
0.8 |
0.4 |
|
Brazil |
-1.6 |
1.5 |
2.6 |
2.8 |
1.9 |
1.2 |
1.0 |
1.1 |
0.6 |
0.5 |
-0.1 |
0.3 |
|
Canada |
-2.0 |
-0.9 |
0.4 |
1.2 |
1.4 |
0.6 |
0.6 |
0.8 |
0.9 |
-0.2 |
1.0 |
0.4 |
|
China |
.. |
.. |
.. |
.. |
.. |
.. |
.. |
.. |
2.1 |
2.3 |
2.3 |
2.0 |
|
France |
-1.6 |
0.1 |
0.3 |
0.6 |
0.1 |
0.5 |
0.4 |
0.3 |
0.9 |
-0.1 |
0.3 |
0.2 |
|
Germany |
-4.0 |
0.3 |
0.8 |
0.7 |
0.5 |
1.9 |
0.8 |
0.5 |
1.3 |
0.3 |
0.6 |
-0.2 |
|
India |
1.1 |
2.6 |
2.6 |
0.9 |
5.5 |
0.2 |
2.3 |
2.3 |
2.4 |
1.2 |
0.9 |
1.8 |
|
Indonesia |
1.1 |
1.3 |
1.8 |
1.3 |
1.5 |
1.6 |
1.4 |
2.2 |
1.1 |
1.6 |
1.4 |
2.1 |
|
Italy |
-3.5 |
-0.2 |
0.4 |
-0.2 |
1.1 |
0.5 |
0.4 |
0.2 |
0.1 |
0.3 |
-0.2 |
-0.7 |
|
Japan |
-3.9 |
1.8 |
-0.2 |
1.8 |
1.5 |
1.3 |
0.6 |
-0.2 |
-1.8 |
-0.3 |
1.7 |
-0.2 |
|
Korea |
0.1 |
2.5 |
3.4 |
0.2 |
2.1 |
1.4 |
0.6 |
0.5 |
1.3 |
0.9 |
0.8 |
0.4 |
|
Mexico |
-6.7 |
0.0 |
2.5 |
2.1 |
0.9 |
1.5 |
0.7 |
1.2 |
0.5 |
1.5 |
1.2 |
0.4 |
|
Russian Federation |
-4.3 |
-1.5 |
1.6 |
1.3 |
1.6 |
0.6 |
-0.1 |
2.2 |
1.1 |
0.3 |
1.3 |
.. |
|
Saudi Arabia |
.. |
.. |
.. |
.. |
.. |
.. |
.. |
.. |
.. |
.. |
.. |
.. |
|
South Africa |
-1.6 |
-0.7 |
0.4 |
0.9 |
1.0 |
0.7 |
0.8 |
1.1 |
1.1 |
0.3 |
0.4 |
0.8 |
|
Turkey |
-5.9 |
5.2 |
4.2 |
1.0 |
0.7 |
3.8 |
1.3 |
3.6 |
1.9 |
1.1 |
1.7 |
.. |
|
United Kingdom |
-1.6 |
-0.2 |
0.2 |
0.7 |
0.4 |
1.1 |
0.7 |
-0.5 |
0.3 |
0.0 |
0.5 |
-0.2 |
|
United States |
-1.7 |
-0.2 |
0.4 |
0.9 |
1.0 |
0.9 |
0.6 |
0.6 |
0.1 |
0.3 |
0.5 |
0.7 |
|
European Union |
-2.5 |
-0.3 |
0.4 |
0.4 |
0.5 |
0.9 |
0.5 |
0.2 |
0.7 |
0.2 |
0.3 |
-0.3 |
|
of which: Euro area |
-2.7 |
-0.2 |
0.5 |
0.4 |
0.4 |
0.9 |
0.4 |
0.3 |
0.8 |
0.1 |
0.1 |
-0.3 |
|
G20 |
-1.6 |
0.7 |
1.2 |
1.3 |
1.5 |
1.2 |
1.0 |
1.1 |
0.8 |
0.8 |
0.9 |
0.7 |
Quarterly GDP in volume terms for the G20
Percentage change on the previous quarter, seasonally adjusted data
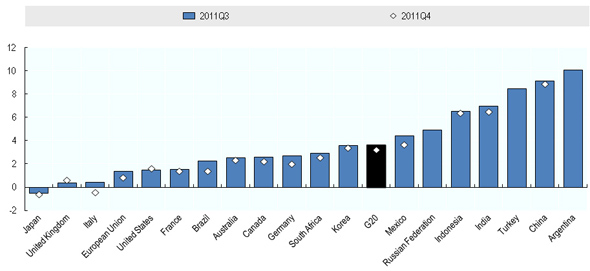
 GDP in volume terms for the G20
Annual percentage change and percentage change on the same quarter of the previous year, seasonally adjusted data
|
|
2009 |
2010 |
2011 |
2009Q4 |
2010Q1 |
2010Q2 |
2010Q3 |
2010Q4 |
2011Q1 |
2011Q2 |
2011Q3 |
2011Q4 |
|
Argentina |
0.9 |
9.2 |
.. |
2.3 |
6.9 |
9.6 |
9.7 |
10.4 |
10.0 |
9.5 |
10.0 |
.. |
|
Australia |
1.5 |
2.4 |
2.2 |
2.7 |
2.5 |
3.0 |
2.4 |
2.2 |
1.2 |
2.0 |
2.6 |
2.3 |
|
Brazil |
-0.3 |
7.5 |
2.7 |
5.3 |
9.1 |
8.8 |
7.1 |
5.4 |
4.1 |
3.3 |
2.2 |
1.4 |
|
Canada |
-2.8 |
3.2 |
2.5 |
-1.4 |
2.1 |
3.6 |
3.8 |
3.3 |
2.9 |
2.1 |
2.6 |
2.2 |
|
China |
9.2 |
10.4 |
9.2 |
.. |
.. |
.. |
.. |
.. |
9.7 |
9.5 |
9.1 |
8.9 |
|
France |
-2.7 |
1.5 |
1.7 |
-0.6 |
1.0 |
1.5 |
1.6 |
1.4 |
2.2 |
1.6 |
1.5 |
1.4 |
|
Germany |
-5.1 |
3.7 |
3.0 |
-2.2 |
2.4 |
4.1 |
4.0 |
3.8 |
4.6 |
2.9 |
2.7 |
2.0 |
|
India |
5.7 |
10.3 |
7.3 |
7.4 |
12.2 |
9.5 |
9.1 |
10.6 |
7.3 |
8.5 |
7.0 |
6.5 |
|
Indonesia |
4.6 |
6.2 |
6.5 |
5.5 |
5.9 |
6.2 |
5.8 |
6.8 |
6.4 |
6.5 |
6.5 |
6.4 |
|
Italy |
-5.5 |
1.8 |
0.4 |
-3.5 |
1.1 |
1.8 |
1.9 |
2.2 |
1.2 |
1.0 |
0.4 |
-0.4 |
|
Japan |
-5.5 |
4.4 |
-0.7 |
-0.6 |
5.0 |
4.5 |
5.2 |
3.2 |
-0.1 |
-1.7 |
-0.5 |
-0.6 |
|
Korea |
0.3 |
6.2 |
3.6 |
6.3 |
8.4 |
7.3 |
4.4 |
4.7 |
3.9 |
3.4 |
3.6 |
3.4 |
|
Mexico |
-6.2 |
5.5 |
3.9 |
-2.4 |
5.5 |
7.2 |
5.2 |
4.3 |
3.9 |
3.9 |
4.4 |
3.7 |
|
Russian Federation |
-7.8 |
4.0 |
.. |
-3.0 |
3.0 |
5.2 |
3.4 |
4.4 |
3.8 |
3.5 |
4.9 |
.. |
|
Saudi Arabia |
0.1 |
4.6 |
6.8 |
.. |
.. |
.. |
.. |
.. |
.. |
.. |
.. |
.. |
|
South Africa |
-1.5 |
2.9 |
3.1 |
-1.0 |
1.6 |
3.0 |
3.3 |
3.6 |
3.7 |
3.3 |
2.9 |
2.6 |
|
Turkey |
-4.8 |
9.0 |
.. |
4.1 |
11.4 |
9.9 |
6.9 |
9.8 |
11.0 |
8.1 |
8.5 |
.. |
|
United Kingdom |
-4.4 |
2.1 |
0.8 |
-0.8 |
1.2 |
2.5 |
3.0 |
1.7 |
1.6 |
0.5 |
0.4 |
0.7 |
|
United States |
-3.5 |
3.0 |
1.7 |
-0.5 |
2.2 |
3.3 |
3.5 |
3.1 |
2.2 |
1.6 |
1.5 |
1.6 |
|
European Union |
-4.3 |
2.0 |
1.5 |
-2.0 |
1.0 |
2.2 |
2.4 |
2.2 |
2.4 |
1.6 |
1.4 |
0.9 |
|
of which: Euro area |
-4.3 |
1.9 |
1.4 |
-2.2 |
1.0 |
2.1 |
2.1 |
2.0 |
2.4 |
1.6 |
1.3 |
0.7 |
|
G20 |
-1.4 |
5.0 |
2.8 |
1.6 |
4.8 |
5.3 |
5.0 |
4.8 |
4.1 |
3.6 |
3.6 |
3.3 |
Quarterly GDP in volume terms for the G20
Percentage change on the same quarter of the previous year, seasonally adjusted data
Technical note for IAG G20 GDP News Release: GDP growth in volume
Gross Domestic Product (GDP) is the standard measure of the value of the goods and services produced by a country during a reference period. The estimate of GDP growth for the G20 aggregate is produced by the OECD Secretariat. It is based on quarterly seasonally adjusted data reported by G20 countries and Eurostat, and, if country data are not available, on estimates from the OECD’s Economics Department.
Country specific cases
China – China is part of the G20 aggregate for all quarters. Data shown in the tables correspond to official figures from the National Bureau of Statistics of China. Quarterly data prior to 2011Q1 are based on estimates from the OECD’s Economics Department, which are not shown in the tables.
Saudi Arabia – Quarterly estimates are based on estimates from the OECD’s Economics Department. While these estimates are not shown in the tables, Saudi Arabia is part of the G20 aggregate for all quarters. Annual data shown in this release correspond to official figures.
The seasonally adjusted data includes a working-day correction for all G20 countries except Argentina, Brazil, China, India, Indonesia, Saudi Arabia, and South Africa. When seasonally adjusted data are not available, national data are adjusted by the OECD Secretariat with the X-12 ARIMA method; this is done for India and Indonesia. Seasonally adjusted data for the G20 are calculated from seasonally adjusted data of the countries (i.e. the indirect method). Growth over the previous quarter is not annualised in this News Release. The charts presented in this News Release are based on data with more than one decimal.
Growth rates for the G20 are derived from chained volume estimates in US dollars converted using 2005 Purchasing Power Parities (PPPs) of GDP.
Country coverage
The G20 aggregate consists of the following: Argentina, Australia, Brazil, Canada, China, France, Germany, India, Indonesia, Italy, Japan, Korea, Mexico, the Russian Federation, Saudi Arabia, South Africa, Turkey, the United Kingdom, the United States, and the European Union. The G20 aggregate is calculated taking the fifteen individual country members of the G20 (other than France, Germany, Italy and the United Kingdom) plus the European Union as an aggregate.
Further information
Further methodological information can be downloaded from: http://www.oecd.org/dataoecd/44/19/49874640.pdf

