
Leveraging Inequality
Finance & Development, December 2010, Vol. 47, No. 4
Michael Kumhof and Romain Rancière
Long periods of unequal incomes spur borrowing from the rich, increasing the risk of major economic crises
THE United States experienced two major economic crises over the past 100 years—the Great Depression of 1929 and the Great Recession of 2007. Income inequality may have played a role in the origins of both. We say this because there are two remarkable similarities between the eras preceding these crises: a sharp increase in income inequality and a sharp increase in household debt–to-income ratios.
Are these two facts connected? Empirical evidence and a consistent theoretical model (Kumhof and Rancière, 2010) suggest they are. When—as appears to have happened in the long run-up to both crises—the rich lend a large part of their added income to the poor and middle class, and when income inequality grows for several decades, debt-to-income ratios increase sufficiently to raise the risk of a major crisis.
Shifting wealth
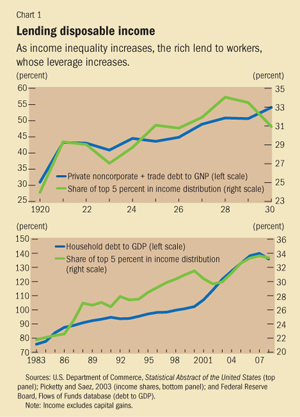
We looked at the evolution of the share of total income controlled by the top 5 percent of U.S. households (ranked by income) compared with ratios of household debt to income in the periods preceding 1929 and 2007 (see Chart 1). The income share of the top 5 percent increased from 24 percent in 1920 to 34 percent in 1928 and from 22 percent in 1983 to 34 percent in 2007 (we used fewer years before 1929 than before 2007 because the earlier data were highly distorted by World War I). During the same two periods, the ratio of household debt to income increased dramatically. It almost doubled between 1920 and 1932, and also between 1983 and 2007, reaching much higher levels (139 percent) in the second period.
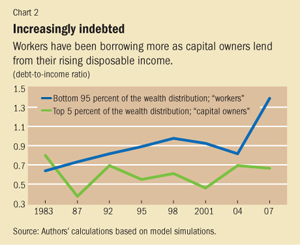
In the more recent period (1983–2007), the difference between the consumption of the rich and that of the poor and middle class did not widen as much as the differences in incomes of these two groups. The only way to sustain high levels of consumption in the face of stagnant incomes was for poor and middle-class households to borrow (see Chart 2).
In other words, the increase in the ratios of debt to income shown in Chart 1 was concentrated among poor and middle-class households. In 1983, the debt-to-income ratio of the top 5 percent of households was 80 percent; for the bottom 95 percent the ratio was 60 percent. Twenty-five years later, in a striking reversal, the ratio was 65 percent for the top 5 percent and 140 percent for the bottom 95 percent.
The poor and the middle class seem to have resisted the erosion of their relative income position by borrowing to maintain a higher standard of living; meanwhile, the rich accumulated more and more assets and invested in assets backed by loans to the poor and the middle class. Consumption inequality that is lower than income inequality has led to much higher wealth inequality.
The higher indebtedness of the bottom income group has implications both for the size of the U.S. financial industry and its vulnerability to financial crises. The bottom group’s greater reliance on debt—and the top group’s increase in wealth—generated a higher demand for financial intermediation.
Between 1981 and 2007, the U.S. financial sector grew rapidly—the ratio of private credit to gross domestic product (GDP) more than doubled, from 90 to 210 percent. The financial industry’s share in GDP doubled, from 4 to 8 percent. With increased debt, the economy became more vulnerable to financial crisis. When a crisis eventually hit in 2007–08, it brought with it a generalized wave of defaults; 10 percent of mortgage loans became delinquent, and output contracted sharply.
There are of course other possible explanations for the origins of the 2007 crisis, and many have stressed the roles of overly loose monetary policy, excessive financial liberalization, and asset price bubbles. Typically these factors are found to have been important in the years just preceding the crisis, when debt-to-income ratios increased more steeply than before. But it can also be argued, as in Rajan (2010), that much of this was simply a manifestation of an underlying and longer-term dynamic driven by income inequality. Rajan’s argument is that growing income inequality created political pressure—not to reverse that inequality, but instead to encourage easy credit to keep demand and job creation robust despite stagnating incomes.
Modeling the facts
An economic model can clearly illustrate these links among income inequality, leverage, and crises. Our model has several novel features that reflect the empirical facts described above. First, households are divided into one income group at the top 5 percent of the income distribution (call them “capital owners”) that derives all its income from returns on the economy’s capital stock and from interest on loans and a second group composed of the remaining 95 percent (“workers”), who earn income in the form of wages. Second, wages are determined by a bargaining process between capital owners and workers. Third, all households care how much they consume, but capital owners also care about how much capital—physical capital and financial assets—they own. This implies that when capital owners’ income increases at the expense of workers, they will allocate it to a combination of higher consumption, higher physical investment, and higher financial investment. The latter consists of increased loans to workers—whose consumption originally accounts for a very high 71 percent of GDP—giving them the means to consume enough to support the economy’s production.
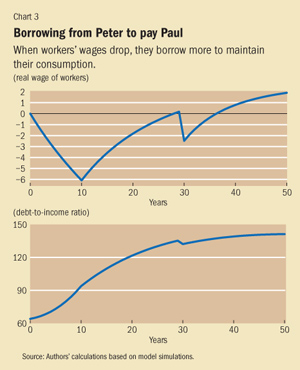
Our model can be used to show what happens after the economy experiences a lengthy shock to the distribution of incomes in favor of capital owners. Workers adjust through a combination of lowering their consumption and borrowing to limit the drop in their consumption (see Chart 3). This gradually raises workers’ debt-to-income ratio, which follows the pattern and magnitude documented in Chart 2. Workers’ higher debt is made possible by the lending of capital owners’ increased disposable income.
More saving at the top and more borrowing at the bottom mean consumption inequality increases significantly less than income inequality. Saving and borrowing patterns of both groups spur a need for financial services and intermediation. As a result, the size of the financial sector roughly doubles. The rise of poor and middle-class household indebtedness begets financial fragility and a higher probability of financial crises. With workers’ bargaining power, and therefore their ability to service and repay loans, recovering only very gradually, loans continue to increase and the risk of a crisis persists. When the crisis does occur—assumed here to materialize after 30 years—there are large-scale household debt defaults on 10 percent of the existing loan stock, accompanied by an abrupt output contraction, as occurred during the 2007–08 U.S. financial crisis.
The model points to a number of ways the increase in debt-to-income ratios in the precrisis period could be more pronounced than shown in Chart 3. First, if capital owners allocate most of their additional income to consumption and financial investment rather than to productive investment, debt-to-income ratios increase much more. The reason is that capital owners are willing to lend at lower interest rates, thereby increasing debt, and the capital stock is lower, thereby reducing output and workers’ incomes. Second, if the rate at which workers’ bargaining power recovers over time is close to zero, even a financial crisis with substantial defaults provides little relief: debt-to-income ratios continue to increase for decades after the crisis, and a series of financial crises becomes very likely.
Policy options
There are two ways to reduce ratios of household debt to income.
The first is orderly debt reduction. What we have in mind here is a situation in which a crisis and large-scale defaults have become unavoidable, but policy is used to limit the collateral damage to the real economy, thereby leading to a smaller contraction in real economic activity. Because this implies a much smaller reduction in incomes for any given default on loans, it reduces debt-to-income ratios much more powerfully than a disorderly default. Still, a long-lasting trend toward higher debt-to-income ratios resumes immediately after the debt reduction, because workers continue to have a reduced share of the economy’s income.
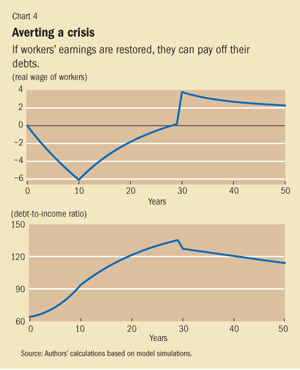
The second possibility, illustrated in Chart 4, is a restoration of workers’ earnings—for example, by strengthening collective bargaining rights—which allows them to work their way out of debt over time. This is assumed to head off a crisis event. In this case, debt-to-income ratios drop immediately because of higher incomes rather than less debt. More important, the risk of leverage and ensuing crisis immediately starts to decrease.
Any success in reducing income inequality could therefore be very useful in reducing the likelihood of future crises. But prospective policies to achieve this are fraught with difficulties. For example, downward pressure on wages is driven by powerful international forces such as competition from China, and a switch from labor to capital income taxes might drive investment to other jurisdictions. But a switch from labor income taxes to taxes on economic rents, including on land, natural resources, and financial sector rents, is not subject to the same problem. As for strengthening the bargaining power of workers, the difficulties of doing so must be weighed against the potentially disastrous consequences of further deep financial and real crises if current trends continue.
Restoring equality by redistributing income from the rich to the poor would not only please the Robin Hoods of the world, but could also help save the global economy from another major crisis. ■
Michael Kumhof is a Deputy Unit Chief and Romain Rancière is an Economist, both in the IMF’s Research Department.
References
Carroll, Christopher D., 2000, “Why Do the Rich Save So Much?” in Does Atlas Shrug? The Economic Consequences of Taxing the Rich, ed. by Joel B. Slemrod (Cambridge, Massachusetts: Harvard University Press).
Dynan, Karen, Jonathan Skinner, and Stephen Zeldes, 2004, “Do the Rich Save More?” Journal of Political Economy, Vol. 112, No. 2, pp. 397–444.
Kumhof, Michael, and Romain Rancière, 2010, “Inequality, Leverage, and Crises,” IMF Working Paper 10/268 (Washington: International Monetary Fund).
Piketty, Thomas, 2010, “On the Long-Run Evolution of Inheritance: France 1820–2050,” PSE Working Paper 2010-12 (Paris: Paris School of Economics).
———, and Emmanuel Saez, 2003, “Income Inequality in the United States, 1913–1998,” The Quarterly Journal of Economics, Vol. 118, No. 1, pp. 1–39.
Rajan, Raghuram, 2010, Fault Lines: How Hidden Fractures Still Threaten the World Economy (Princeton, New Jersey: Princeton University Press).
Reich, Robert, 2010, Aftershock: The Next Economy and America’s Future (New York: Random House).
Reiter, Michael, 2004, “Do the Rich Save Too Much? How to Explain the Top Tail of the Wealth Distribution,” Universitat Pompeu Fabra Working Paper (Barcelona).
Schneider, Martin, and Aaron Tornell, 2004, “Balance Sheet Effects, Bailout Guarantees and Financial Crises,” Review of Economic Studies, Vol. 71, No. 3, pp. 883–913.

Write to us
F&D welcomes comments and brief letters, a selection of which are posted under Letters to the Editor. Letters may be edited. Please send your letters to fanddletters@imf.org