
A World of Change
Finance & Development, September 2014, Vol. 51, No. 3
M. Ayhan Kose and Ezgi O. Ozturk
Taking stock of the past half century
The slow one now
Will later be fast
As the present now
Will later be past
The order is rapidly fadin’
And the first one now will later be last
For the times they are a-changin’
From “The Times They Are a-Changin’” by Bob Dylan, 1964

When the inaugural issue of Finance & Development appeared in June 1964, the world economy was enjoying its best 10-year growth performance since World War II. The massive postwar reconstruction effort of the preceding decade led to vibrant growth in Europe and Asia. The U.S. economy, which accounted for almost one-third of world output during the 1960s, was experiencing its longest expansion to date.
In the same year, Bob Dylan’s timeless song captured the rapidly changing nature of the times. Although Dylan probably did not have global production in mind, the world economy witnessed some truly unimaginable changes during the ensuing half century. Some low-income countries with chronic development problems started growing much faster and eventually became major contributors to global growth. The world economic order went through a tectonic transformation, accompanied by, and in part caused by, groundbreaking advances in science and technology and the rise of globalization.
How has the global economy changed since 1964? We present an eclectic answer to this question by summarizing some major changes over the past 50 years. The progress the world economy experienced during this period has been impressive. There is still a glaring need for progress in many areas, but there is also cause for optimism.

New technologies
Had we written this article in 1964, we would have used typewriters, not computers, and might have relied for background research on hard copies of journals and books. It could have taken many weeks to assemble the related statistics and to translate them into the charts. It could, as well, have taken several weeks to ship printed issues of the magazine to readers around the world.
Thanks to many technological developments over the past half century, today we have instant access to a vast array of information sources and are able to share new knowledge with the rest of the world in seconds. Rapid progress in communication and transportation technologies has facilitated major innovation in many other fields, radically changed how we work, raised productivity, and led to stronger international trade and financial links.
How we communicate has changed the most, as advances in computers and mobile technologies have revolutionized all mediums of communication. In 1965, the first commercially successful minicomputer had an inflation-adjusted price tag of $135,470. It was able to undertake basic computations, such as addition and multiplication. Its capacity was about 4,000 words of 12 bits. Today’s typical smartphone has a capacity 3 million times larger and costs less than $600.
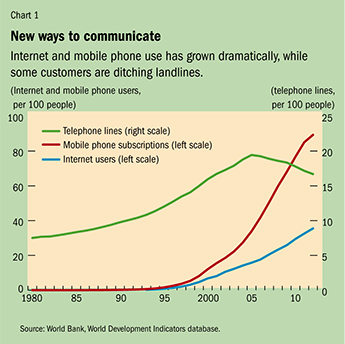
The introduction of the Internet to the public in 1991 started a new era in communication. The tremendous increase in Internet access has brought people, businesses, and countries closer, while mobile communication has become cheaper and more accessible. In 1965, the first commercial communications satellite was launched from the United States, providing 240 two-way telephone circuits. Today, there are about 400 commercial communication satellites processing and transmitting information across the world, with a capacity that dwarfs 1965. In 1980, there were five mobile phone subscriptions for every million people; today there are more than 90 for every 100 people (see Chart 1). New technologies have been making earlier modes of communication obsolete. With the rapid rise of wireless communication, landlines, for example, have declined during the past decade.
The transportation sector has also gone through a major change over the past 50 years. Today, we can travel and ship goods much faster and more cheaply than a half century ago. A round-trip airline ticket from Miami to New Orleans in the early 1960s was $927 (inflation adjusted); it now costs about $330. With the availability of cheaper and faster communication and declining shipping costs, even small businesses have access to overseas markets.
Although annual global energy consumption from primary resources (fossil fuel, natural energy, nuclear power) has more than tripled over the past half century, technological improvements in the energy sector made production more efficient than ever. To produce $1,000 in output, the world used the equivalent of 137 kilos of oil in 2011, 50 fewer than 20 years earlier. The global oil supply as a percent of total primary energy supply has also declined with increased supplies of natural gas, nuclear power, and renewable energy sources such as geothermal, solar, and wind.
Rise of globalization
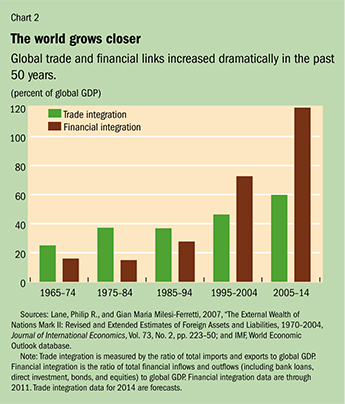
“We live in a global world.” This sentence did not mean much in 1964. However, it has become a cliché, especially over the past two decades with the rise of globalization—the growing trade and financial integration of the world economy (see Chart 2). Advances in communication and transportation technologies coincided with and fostered accelerated globalization as countries became more interdependent through a rapid increase in cross-border movement of goods, services, capital, and labor—and led to much faster diffusion of ideas and cultural products.
The past 50 years have witnessed profound changes in the volume, direction, and nature of international trade: global trade in goods and services has risen rapidly, aided by the liberalization of trade policies around the world. Intraregional trade flows have also become more prominent with the proliferation of regional trade agreements. Trade in manufacturing goods has grown rapidly, and led to cross-border supply chains—companies can now locate different stages of the production process in several countries.
The change in international financial flows has been even more dramatic: the fraction of countries with a liberalized financial system has risen threefold over the past 50 years. As more countries have embraced the benefits of permitting the free movement of capital, international financial flows have increased markedly. Total global financial assets rose from $250 billion in 1970 to almost $70 trillion in 2010. The composition of international financial flows has also changed: the share of portfolio equity investments is much larger.
Although the extent of integration of labor markets across countries is much lower than that of trade and financial markets, cross-border movements of labor have also registered a considerable increase over the past 50 years. About 230 million people live as migrants today, up from 77 million in 1970. Two decades ago, people migrated mostly from developing to developed economies. Regional migration between developing economies now exceeds migration to developed economies.
New global actors
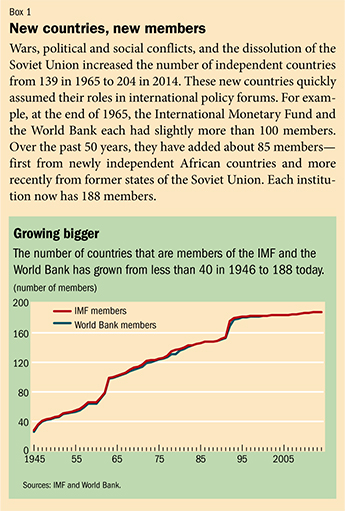
A number of countries became independent during the past 50 years (see Box 1). In much of this period, however, a bipolar world economy—composed of developing countries in the South and developed countries in the North—was the norm. The South consisted of mostly poor and labor-abundant economies that supplied agricultural products and raw materials to the North. The countries of the North were richer and more developed. They produced manufactured goods and accounted for the bulk of global trade and financial flows.
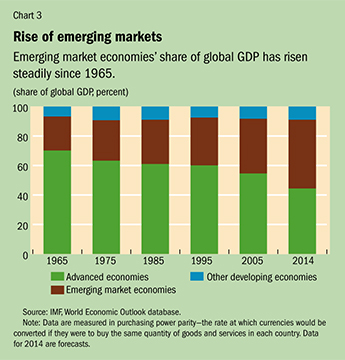
Since the mid-1980s, however, some of the countries of the South, the so-called emerging market economies, have grown at an extraordinary pace while rapidly integrating into the global economy. They have also diversified their production base and exports toward manufactured goods and services and away from agricultural products.
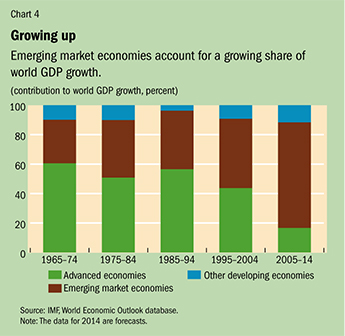
While their shares of world population and labor force have remained relatively stable over the past 50 years, the emerging market economies have established a growing presence in every other economic dimension. As a group, their share of global GDP nearly doubled (see Chart 3). Their contribution to global growth was on average 30 percent between 1965 and 1974, roughly half that of advanced economies in that period. During the past decade, they accounted for more than 70 percent of global growth, while advanced economies’ share fell to about 17 percent (see Chart 4). Emerging market economies have also become the main engine of global trade while rapidly establishing stronger banking and other financial links with the rest of the world.
Some emerging market economies have performed even better. For example, Brazil, Russia, India, and China, the so-called BRIC countries, accounted for half of global growth over the past decade. China is now the world’s 2nd and Brazil the 7th largest economy, up from the 8th and the 16th, respectively, in 1970. The list of the 20 largest economies now includes South Korea and Indonesia, which were nowhere close a few decades ago.
Painful interruptions
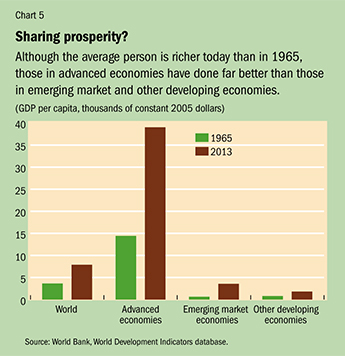
The world economy is six times larger than it was half a century ago, growing at an annual rate of 4 percent during the period. New technologies have paved the way for more efficient production systems in a wide range of industries and promoted economic growth. From 1965 to 2013, the average annual growth rate of world GDP per capita was about 2 percent, and in more than half of the past 50 years, the world grew faster than this average. As a result, global per capita GDP more than doubled between 1965 and 2013 despite a major increase in population (see Chart 5).
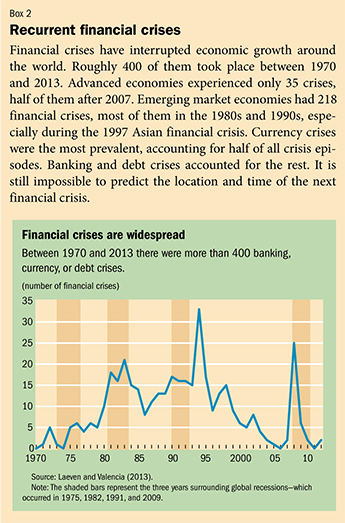
But the global growth process itself has never been smooth. Many countries experienced financial crises that led to significant declines in their growth during the past half century (see Box 2). The global economy also went through periods of severe interruptions in growth. In every decade after the 1960s, there was a global recession (see Chart 6). In 1975, 1982, 1991, and 2009, world per capita output declined and various other measures of global activity fell simultaneously (Kose and Terrones, forthcoming).
Each of these global recessions coincided with severe economic and financial disruptions in many countries around the world. A sharp increase in oil prices triggered the 1975 recession. A series of global and national shocks—including another jump in oil prices in 1979, the U.S. Federal Reserve’s battle against high inflation in 1979 and 1980, and the Latin American debt crisis—played significant roles in the 1982 recession.
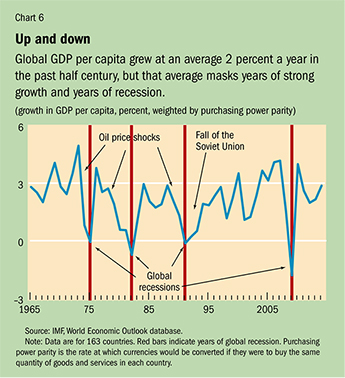
Although the 1991 recession coincided with many adverse global and national developments, it became a worldwide event because various domestic difficulties were transmitted to other countries: financial disruptions in the United States, Japan, and several Scandinavian countries; exchange rate crises in many advanced European economies; German unification; and the collapse of the Soviet Union. The 2009 episode started with a financial crisis in the United States in 2007, but rapidly spread to other advanced economies and some emerging markets through trade and financial linkages.
Each global recession lasted only a year, but exacted deep and long-lasting human and social costs: millions lost their jobs, businesses closed, and financial markets plunged. The most recent global recession was the deepest since the Great Depression of the 1930s: worldwide, the number of unemployed people rose by almost 20 percent between 2007 and 2009. In 2009, 83 million young people were unemployed—more than at any time in the past two decades. The global economy, especially labor markets, still suffers the effects of the 2009 recession, seven years after the beginning of the crisis.
Poverty and inequality
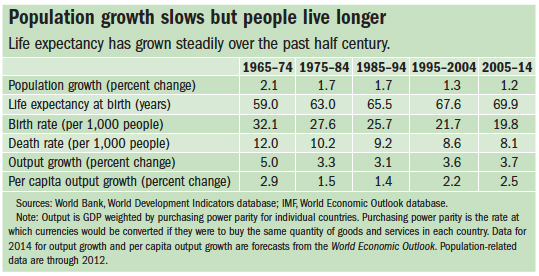
The world population grew from 3 billion in 1965 to about 7 billion in 2013, but the global economy grew faster than the world population, leading to a better standard of living for the average world citizen.
Improvements in medical technology, sanitation, and vaccination helped reduce the death rate and, despite declining birth rates, the world population has kept rising as people enjoy longer lives. In the mid-1960s, life expectancy at birth was about 55 years; today a newborn is expected to live about 70 years (see table).
There has been progress in schooling too. The number of children completing primary education increased from 80 percent of the global school-age population in the 1980s to 92 percent in 2012. In low-income countries, this change has been more dramatic—from 45 percent to slightly more than 70 percent in the past three decades.
The average world citizen is richer than ever thanks to the growth the global economy has enjoyed over the past 50 years. However, the benefits of this growth have not been equally distributed—the result is enduring poverty and inequality.
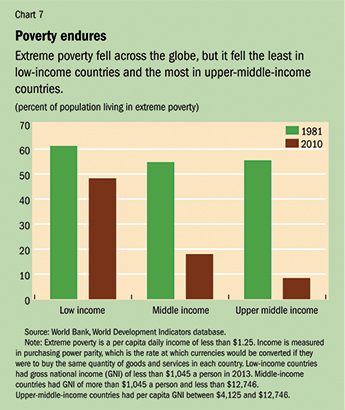
One of the Millennium Development Goals the United Nations agreed to in 2000 was to reduce extreme poverty by half between 1990 and 2015. Although that goal was achieved five years ahead of schedule, extreme poverty remains widespread in a number of low-income countries. In 1981, the percent of people living on less than $1.25 a day, the extreme poverty line, was about half in both upper-middle- and low-income countries (see Chart 7). Thirty years later, upper-middle-income countries have achieved a substantial decline in poverty thanks mostly to rapid growth in emerging market economies. However, in low-income countries, almost half of the population still lives in extreme poverty. At the global level, more than a billion people, mostly in sub-Saharan Africa and south Asia, are in extreme poverty.
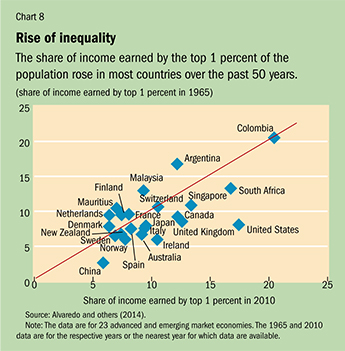
Inequality has also increased in most countries. For example, from 1990 to 2010, inequality increased in more than two-thirds of countries with data available. Cross-country inequality reached its highest level in the late 1990s and then started declining, but is still higher than in the early 1980s. Moreover, the share of income earned by the top 1 percent of the population has risen in most of the major advanced and emerging market economies (see Chart 8). For instance, in the United States, the richest 1 percent of the population receives about 18 percent of national income today, compared with about 8 percent 50 years ago.
A major challenge of a different sort for the global economy is climate change. Carbon dioxide emissions have risen significantly, especially over the past two decades, and appear to have led to a wide range of problems, including rising sea levels, melting glaciers, and more extreme weather events. The number of reported weather-related natural disasters has increased more than three times since the 1960s. In addition to extreme poverty, low-income countries are vulnerable to the risks stemming from climate change. Although there has been progress in regulating global emissions of greenhouse gases over the past 25 years, much more needs to be done to mitigate the adverse effects of climate change.
Looking back, looking forward
The world economy has gone through a period of great transformation since 1964. The breathtaking pace of technological progress and international integration has resulted in a truly global village, where countries are much closer because of faster and better modes of communication and stronger trade and financial linkages than could have been imagined 50 years ago. The world economy moved from a bipolar to a multipolar configuration with emerging market economies now accounting for the lion’s share of global growth. There has been considerable progress in elevating living standards in many corners of the world. However, much still needs to be done to improve macroeconomic and financial policies to allow a better response to financial crises and to reduce poverty and inequality.
The good news is that there is clear recognition of these massive challenges. And, through multilateral organizations—such as the International Monetary Fund and the World Bank, which turn 70 this year—there has been a concerted effort to overcome them. The IMF has taken steps to improve its policy advice for crisis prevention and management and enhanced its macroeconomic and financial sector surveillance facilities. The Bank has implemented measures to achieve its newly established “twin” goals of ending extreme poverty at the global level within a generation and promoting “shared prosperity” aimed at improving the well-being of the poorer segments of society. There is also consensus that, while generating growth is critical to overcoming many challenges, that growth must include all segments of society and be environmentally friendly and sustainable.
There has been lively debate about the future of the world economy after the global financial crisis. Some argue that advanced economies will likely enter a period of secular stagnation because of misguided policies. Others claim that the days of robust growth are behind us because today’s innovations are less useful than the major inventions of the past. Another view, though, is that the global economy has enormous potential to generate a healthy dose of growth in the coming decades. Innovations, well-designed policies, and vibrant emerging market and frontier economies can help realize that potential.
No one could have accurately predicted the changes the world economy has experienced during the past half century. And no one can predict what an article like this one will say in 2064. But one prediction is as true today as in Dylan’s 50-year-old song: “the times they are a-changin’.” ■
M. Ayhan Kose is Director of the Development Prospects Group of the World Bank and Ezgi O. Ozturk is Research Officer in the Research Department of the IMF.
References
Alvaredo, Facundo, Tony Atkinson, Thomas Piketty, and Emmanuel Saez, 2014, The World Top Incomes Database. http://topincomes.g-mond.parisschoolofeconomics.eu
Kose, M. Ayhan, and Marco E. Terrones, forthcoming, Collapse and Revival: Understanding Global Recessions and Recoveries (Washington: International Monetary Fund).
Laeven, Luc, and Fabián Valencia, 2013, “Systemic Banking Crises Database,” IMF Economic Review, Vol. 61, No. 2, pp. 225–70.

Write to us
F&D welcomes comments and brief letters, a selection of which are posted under Letters to the Editor. Letters may be edited. Please send your letters to fanddletters@imf.org