
Down the Slide
Finance & Development, December 2015, Vol. 52, No. 4
John Baffes, M. Ayhan Kose, Franziska Ohnsorge, and Marc Stocker

The collapse in oil prices since 2014 is the most recent of several in the past three decades and may portend a long period of low prices
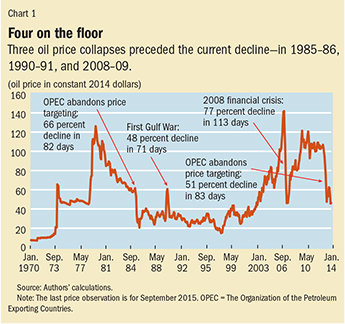
After four years of relative stability at about $100 a barrel, oil prices began a more than 50 percent slide in June 2014. The dramatic drop in oil prices joins the decline in the price of other commodities in marking what appears to be the end of a boom, or supercycle, that began in the early 2000s. But the oil price decline is not an unprecedented event. Before the current collapse there were three large declines in oil prices (see Chart 1).
Each of those earlier declines coincided with major changes in oil markets and the global economy. The recent collapse in prices has triggered not only intense debate about its causes and consequences, but has also raised questions about how it compares with those previous episodes.
We analyzed the main features of each episode and found that although each of the collapses had its own narrative, the first and the most recent have eerier similarities, which include a rapid expansion in unconventional supplies and a shift in policy by the Organization of the Petroleum Exporting Countries (OPEC) after a period of high prices. These similarities suggest that oil prices will remain relatively low for some time.
Underlying demand and supply conditions for oil determine long-run price trends as do expectations about future developments. But expectations can also play a role in short-run movements in market sentiment. During the current oil price plunge, revisions of supply and demand expectations were noticeable, but neither exceptional nor unusually large—and by themselves unlikely to cause such a massive price disruption.
Behind the recent collapse
But these changes in expectations coincided with four other major developments: a rapid increase in U.S. oil output, a significant shift in the objectives of OPEC, receding geopolitical risks, and significant dollar appreciation. These factors, coupled with longer-term shifts in supply and demand dynamics, formed a perfect storm that sent prices plummeting:
- Supply and demand: Global oil markets have been affected by a long-term trend of greater-than-anticipated supply, especially from unconventional sources of oil production in the United States and, to a lesser degree, from Canadian oil sands and the production of biofuels (produced from plants such as corn or sugarcane). An increase in oil prices after 2009 and exceptionally favorable financing conditions made extracting oil from tight rock formations (shale sources) in the United States profitable and led to a significant increase in U.S. oil production (see Chart 2). These unconventional oil projects differ from standard drilling operations in that they have relatively low capital costs and a much shorter life cycle—2.5 to 3 years from the start of development to full extraction compared with decades for conventional drilling. At the same time that oil supplies were predicted to rise, oil demand forecasts were downgraded as global growth repeatedly disappointed since 2011 (see Chart 3). While both supply- and demand-related factors played a role in driving down oil prices, empirical estimates indicate that supply (much more than demand) factors have accounted for most of the latest plunge.
- OPEC objectives: The roughly 36 million barrels a day that OPEC countries produce account for 40 percent of global oil supply, and although its share of global production is less than it was a decade ago, OPEC still has the potential to be the swing producer in global oil markets if it chooses (see box). That is, OPEC has enough spare production capacity to easily increase or decrease the supply of oil to affect its price. Through the early 2010s, OPEC’s desired price range for crude oil increased gradually from $25 to $35 a barrel in the early 2000s to $100 to $110 a barrel. However, because of the high price target and rising unconventional oil production, OPEC’s share of global oil supply was at risk of steadily eroding. To stem further losses of market share, several OPEC members in the third quarter of 2014 began to offer discounts to Asian oil importers, signaling OPEC’s intentions to abandon price targeting. At its meeting in November 2014, OPEC left unchanged the production quotas that were agreed to in December 2011, implying that it would no longer act as the swing oil producer.
- Geopolitical developments: Oil prices have long been influenced by political tensions in oil-producing regions. Although unconventional oil supplies were adding more than 1 million barrels a day to global production as early as 2010, at first this extra supply merely made up for losses from various producers in the Middle East and North Africa. But by the second half of 2014, it became apparent that conflicts in the Middle East and eastern Europe were not having as severe an impact on oil supply as expected. Libya, despite internal conflict, added 500,000 barrels a day of production in the third quarter of 2014. In Iraq, as the advance of the Islamic State stalled, it became apparent that oil output would not be disrupted. Finally, the sanctions and countersanctions imposed after June 2014 as a result of the Russia-Ukraine conflict have had little effect on European energy markets.
- Appreciation of the dollar: Since June 2014, the dollar has appreciated by more than 15 percent against major currencies in trade-weighted terms (see Chart 4). Typically, a broad-based appreciation of the dollar tends to raise the local currency cost of oil in countries using currencies not linked to the dollar, making for weaker demand in those countries. It also prompts an increase in supply from non–dollar producers, such as Russia, whose input costs are mostly denominated in local currencies.


The last cartel standing
The largest player in the global crude oil market is the Organization of the Petroleum Exporting Countries (OPEC), which was founded in 1960 to “coordinate and unify petroleum policies among member states.” OPEC has 12 active members—Algeria, Angola, Ecuador, the Islamic Republic of Iran, Iraq, Kuwait, Libya, Nigeria, Qatar, Saudi Arabia, the United Arab Emirates, and Venezuela.
OPEC began to play an important role in global oil markets after it decided to impose an embargo on oil exports in 1973, which resulted in a quadrupling of oil prices—from $2.70 a barrel in September 1973 to $13 a barrel in January 1974. OPEC actions were also instrumental in the tripling of oil prices from $12.85 in October 1978 to $40.75 in November of 1979. Efficiency gains and new oil suppliers, along with disagreements among various OPEC members (especially during the Iran-Iraq and first Gulf wars), reduced the cartel’s role for the next two decades. OPEC countries again acted in concert to raise prices following the Asian financial crisis in 1997, when oil prices dropped to less than $10 a barrel.
Efforts to manage world commodity markets to achieve price objectives are not unique to the oil market. A number of commodity agreements, often negotiated among producing and consuming nations to stabilize prices at levels deemed fair to both, were put in place following World War II and included cocoa, coffee, natural rubber, olive oil, sugar, tin, and wheat. However, the price and trade restrictions imposed by some of the agreements either encouraged the emergence of competing products or new producers. As a result, all of these non-oil agreements collapsed. A key difference between OPEC and the earlier commodity agreements is that OPEC does not have a legal clause on how to intervene when market conditions warrant, which allows it flexibility in responding to changing circumstances.

Past as prologue
There were three large oil price declines before the current one—in 1985–86, in 1990–91 during the first Gulf War, and in 2008–09 during the global financial crisis (see table).

The collapse of oil prices in 1986 was preceded by several years of high oil prices precipitated by the 1979 revolution in Iran. OPEC’s practice was to set official prices for the various types of crude oil produced by its members, with highly prized light oil from Saudi Arabia the benchmark. The price of Saudi light was set at $34 a barrel in 1981. High prices and a global recession in the early 1980s led to a large decline in oil consumption, mainly in advanced economies. High prices also encouraged fuel conservation, substitution of other fuels for oil—especially in electricity generation, including from nuclear power—and efficiency gains, particularly higher minimum fuel efficiency standards for automobiles. The high prices also sparked non-OPEC production, notably in the U.S. state of Alaska, in Mexico, and in the North Sea. Weak demand and rising non-OPEC output forced OPEC to cut its production nearly by half, most of which was absorbed by Saudi Arabia. Nevertheless, Saudi light prices declined to $28 a barrel in 1985, because of both sluggish global economic activity and the decision of several members to discount official prices to increase exports. By 1985, Saudi Arabia had seen its oil production drop to 2.3 million barrels a day from 10 million a few years earlier. To regain market share, it raised production, abandoned official pricing, and adopted a spot pricing mechanism.
The 1990–91 crash was the indirect result of Iraq’s August 1990 invasion of Kuwait. For a number of years before the invasion oil prices were low. North Sea (Brent) oil averaged less than $17 a barrel over the previous five years. Iraq’s invasion of Kuwait and the subsequent Iraq war to restore Kuwait’s independence removed more than 4 million barrels a day of combined Iraqi and Kuwaiti crude oil from the market. Other OPEC members had more than enough untapped capacity to cover this shortfall, but it took time for them to ramp up output, so prices rose sharply. Brent prices briefly rose above $40 a barrel in September 1990 before slowly retreating to $28 in December as additional supplies reached the market. The ensuing price crash in mid-January 1991 was sharp and sudden. Prior to the war the International Energy Agency (IEA) agreed that if there were war, its largely advanced economy members would release 2.5 million barrels a day from the emergency crude oil stocks they held in reserve. The IEA action and the apparent early success of coalition forces in ending Iraqi control of Kuwait prompted an immediate decline in prices to under $20 a barrel. The 1990–91 crash then was a reversion of prices to their low prespike levels following an external shock. It differed from the other three, in which the crash followed a prolonged period of high prices.
The 2008–09 price decline was the biggest since World War II and was a response to the global financial crisis that began in 2008. During the second half of 2008, oil prices fell more than 70 percent. The price collapse, which reflected global uncertainty and a drastic reduction in demand, was not unique to oil. Most equity markets experienced similar declines, as did other commodity prices, including for other energy products, such as coal; metals; food commodities; and agricultural raw materials, such as natural rubber. The 2008 oil price crash was also accompanied by a spike in volatility, and most commodity prices, including oil, fell at about the same rate. The severity of the 2008 oil price collapse had its roots in OPEC’s decision in the early 2000s to return to restricting oil supplies. It briefly targeted a crude oil price range of $22 to $28 a barrel. However, when prices exceeded that range in 2004, OPEC gradually raised its “preferred target” to eventually reach $100 to $110 a barrel. As the financial crisis unfolded and recession gripped the advanced economies in 2008–09, prices dropped to less than $40 a barrel. Within two years, though, prices surged back to the $100 mark, helped by stronger demand as the global economy rebounded and supported by OPEC’s decision to take 4 million barrels a day off the market.
Comparisons
There are some critical similarities and differences among the four oil price collapses.
Most striking are the similarities between the 1985–86 crash and the current one. Both occurred after a period of high prices and increased production from non-OPEC countries—in 1985–86 from Alaska, the North Sea, and Mexico and in the current collapse from oil shale in the United Sates, oil sands in Canada, and biofuels. In both crashes, OPEC changed its policy objective from varying output to maintain a targeted price to selling flat out to maintain its market share. There are similarities between the 1990–91 and 2008–09 crashes as well. Both were precipitated by global events: the first Gulf War and the 2008 global financial crisis.
The most recent oil price collapse is similar in many ways to those in the 1980s and during the global financial crisis. However, there are also marked differences between the two most recent oil price declines. The fall in the price of oil that began in 2014 was considerably sharper than the decline in the prices of other commodities. In 2008–09 virtually all commodity prices declined by similar magnitudes as a result of a severe global recession, and most commodity prices, including the price of oil, recovered just as quickly after the recession bottomed out. Other price and market developments also suggest that the recent episode was driven by a range of mostly oil-industry-specific factors, whereas the 2008–09 episode was due to broad factors—a severe collapse in demand following the global financial crisis, global uncertainty, and liquidity constraints. For example, oil prices have been less correlated with prices of other commodities since late 2014 than they were in 2008–09. Moreover, oil prices were less correlated with prices in equity markets during the latest episode than they were during the global financial crisis.
Prospects for oil markets
Recent developments that led to the plunge in prices appear to have affected oil markets in a lasting way that will probably result in lower oil prices for some time. As costs of unconventional production continue to decline sharply, unconventional oil suppliers are likely to continue to be significant players. They could take over OPEC’s role as a swing producer because unconventional output can adjust reasonably quickly to changes in demand. The new swing role could be cemented if OPEC continues its current policy stance over the near term, aiming less at keeping prices high and more at maintaining its share of the oil market—as it did following the 1985–86 plunge. Moreover, a long-standing global trend toward production technologies that use less oil will continue to tamp down increases in demand for oil and thus put pressure on oil prices.
Over time, however, a slow pickup in global economic growth should gradually lift global oil prices. Oil prices could also increase rapidly if unconventional suppliers cut their production significantly. As has happened in the past, an escalation of geopolitical tensions could drive prices up. Nonetheless, the sharp drop in prices since mid-2014 has been one for the record books as a major episode with likely lasting effects on the global oil markets. ■
John Baffes is a Senior Economist, M. Ayhan Kose is a Director, Franziska Ohnsorge is a Lead Economist, and Marc Stocker is a Senior Economist in the Prospects Group of the Development Economics Vice Presidency of the World Bank.
This article is based on a 2015 World Bank Policy Research Note, “The Great Plunge in Oil Prices: Causes, Consequences, and Policy Responses,” by John Baffes, M. Ayhan Kose, Franziska Ohnsorge, and Marc Stocker.

Write to us
F&D welcomes comments and brief letters, a selection of which are posted under Letters to the Editor. Letters may be edited. Please send your letters to fanddletters@imf.org