 About F&D Subscribe Back Issues Write Us Copyright Information Free Email Notification Receive emails when we post new
items of interest to you. |
External Debt and Growth Catherine Pattillo, H�l�ne Poirson and Luca Ricci
Reasonable levels of external debt that help finance productive investment may be expected to enhance growth, but beyond certain levels additional indebtedness may reduce growth. An IMF study estimates two critical turning points: when additional debt slows growth and when it contributes negatively to growth, making the
country worse off.
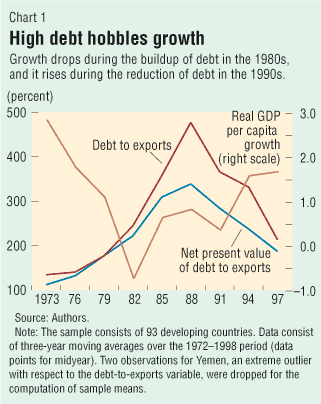
Over the past three decades, developing countries have borrowed large amounts, often at highly concessional interest rates (Chart 1). The hope was that these loans would put them on a faster development path through higher investment and faster growth. But as debt ratios reached very high levels in the 1980s, it became clear that for many of these countries, repayment would not just constrain economic performance but be virtually impossible. Thus, in the 1980s, several middle-income countries—particularly in Latin America—faced severe debt crises and, in the mid-1990s, the IMF and the World Bank launched the Heavily Indebted Poor Countries (HIPC) Initiative to bring the debt of low-income countries—most of which are in sub-Saharan Africa—to sustainable levels. Despite the importance of this issue and the public attention it has received, including from the Pope and rock stars, policymakers and economists around the world still have only a partial understanding of fundamental questions, such as
We conducted a study that examined these questions, looking at nearly 100 developing countries over a 30-year period. Countries heavily dependent on oil exports, countries with populations of less than 400,000, and countries in transition are excluded from the analysis.
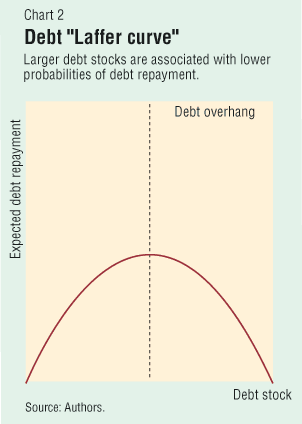
 What theory tells us Economic theory suggests that reasonable levels of borrowing by a developing country are likely to enhance its economic growth. Countries at early stages of development have small stocks of capital and are likely to have investment opportunities with rates of return higher than those in advanced economies. As long as they use the borrowed funds for productive investment and do not suffer from macroeconomic instability, policies that distort economic incentives, or sizable adverse shocks, growth should increase and allow for timely debt repayments. These predictions hold up even in theories based on the more realistic assumption that countries may not be able to borrow freely because of the risk of debt repudiation. Why do large levels of accumulated debt lead to lower growth? The best-known explanation comes from "debt overhang" theories, which show that if there is some likelihood that, in the future, debt will be larger than the country's repayment ability, expected debt-service costs will discourage further domestic and foreign investment and thus harm growth. Potential investors will fear that the more a country produces, the more it will be "taxed" by creditors to service the external debt, and thus they will be less willing to incur costs today for the sake of increased output in the future. This argument is represented in the debt "Laffer curve" (Chart 2), which posits that larger debt stocks tend to be associated with lower probabilities of debt repayment. On the upward-sloping or "good" section of the curve, increases in the face value of debt are associated with increases in expected debt repayment, while increases in debt reduce expected debt repayment on the downward-sloping or "bad" section of the curve.
 Although the debt overhang models do not analyze the effects on growth explicitly, the implication is that large debt stocks lower growth partly by reducing investment. But in addition, the incentive effects associated with debt stocks tend to reduce the benefits to be expected from policy reforms that would enhance efficiency and growth, such as trade liberalization and fiscal adjustment: the government will be less willing to incur current costs if it perceives that the future benefit in terms of higher output will accrue partly to foreign lenders. Thus, some considerations suggest that, at reasonable levels of debt, further borrowing would be expected to have a positive effect on growth. Others stress that large accumulated debt stocks may be a hindrance to growth. Both these elements together imply that debt is likely to have nonlinear effects on growth. Although the debt overhang theories have not explicitly traced the effect on growth, it may be possible to extend and translate the debt Laffer curve posited by these models into a Laffer curve for the effect of debt on growth. Since the peak of the debt Laffer curve shows the point at which rising debt stocks begin acting as a tax on investment, policy reforms, or other activities that require up-front costs in exchange for future benefits, the peak may relate to the point at which debt begins to have a negative marginal impact on growth. How are debt and growth linked? In our study, we tried to find out if this type of curve exists, essentially asking, what is the link between debt and growth? To do this, we used various debt stock indicators, including a recent World Bank data set that measures the net present value of debt—a measure that takes into account the fact that a significant part of the external debt is contracted at an interest rate below the prevailing market rate. This is important because most studies have simply considered debt ratios (to exports and to GDP) in nominal terms, whereas most countries sampled have contracted debt at concessional rates—meaning that the actual amount they will have to repay in the future is less than the face value of the debt. To properly identify the debt overhang effect through the above debt stock indicators, we also include the ratio of debt service to exports to control for any crowding-out effects arising from resources being spent on debt service instead of investment or growth-enhancing domestic spending. We found that debt does indeed seem to have an inverted-U relationship with growth (Chart 3, next page). When countries open up to foreign capital and start borrowing, the impact on growth is likely to be positive (moving from zero indebtedness to point A in Chart 3). As debt ratios increase beyond point A, additional debt eventually slows growth down even though the overall debt level continues to make a positive contribution to growth. Thus, point A can be considered as the growth-maximizing level of debt. When debt reaches point B, however, the overall contribution of debt turns negative: the country becomes worse off than in the case of no indebtedness.
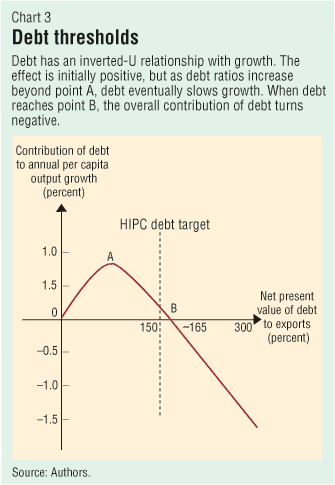 Besides confirming this inverted-U relationship between debt and growth, our study also quantifies the two critical turning points. The one we can identify with more confidence is point B: the overall contribution of debt to growth appears to become negative at 160-170 percent of exports and 35-40 percent of GDP (in net present value terms). The marginal impact appears to become negative (point A) at about half these levels, although our results do not allow us to estimate those levels precisely. The results also indicate that the growth differential between countries with low indebtedness (less than 100 percent of exports or 25 percent of GDP) and those with the highest indebtedness (more than 367 percent of exports or 95 percent of GDP) is, on average, in excess of 2 percent a year. Our results were found to be robust across the many specifications, methodologies, and debt indicators employed (see box). In particular, it is interesting to note that debt indicators based on the face value or the net present value of debt generate similar results. This outcome is consistent with the fact that the countries that benefit from concessional lending (or from debt restructuring at concessional rates) are those that already have excessive indebtedness.
Does our study shed any light on how debt affects growth? It provides indirect evidence that the efficiency of investment—not the quantity of investment—might be the relevant channel. In fact, all of the results depicted above hold in regressions where investment is also controlled for, and the impact of debt on growth is only slightly stronger when we eliminate investment from the regressions. Thus, our results confirm the theoretical claims that excessive debt is likely to constrain growth not just by lowering how much is spent on investment activities but also by distorting their allocation (for example, toward projects with short-term horizons even if less efficient) and perhaps altering the incentives for policymakers to provide a healthy policy environment. This is consistent with recent empirical claims that total factor productivity rather than factor accumulation is the main determinant of growth differences across countries. Implications for HIPC Initiative What might our findings imply for policymakers? The growth dividend that may be expected from debt reduction can be quantified. For example, halving indebtedness from, say, 200 percent of exports (close to the debt-to-export ratio carried by the average country in the sample over the past three decades) to 100 percent of exports would boost per capita growth by about a half to a full percentage point. How about the heavily indebted poor countries? For most of those countries on the verge of being approved for debt relief, debt-to-export ratios average about 300 percent. If their debt loads were lowered to the target of 150 percent, our study seems to indicate that this would raise growth by about 1 percentage point. This increase in growth might initiate a virtuous cycle that, in the absence of additional increases in debt levels, would help to further reduce indebtedness ratios. Clearly, however, such a growth dividend might not occur because these economies are often severely affected by other macroeconomic and structural distortions.
This article is based on the authors' "External Debt and Growth," IMF
Working Paper 02/69 (Washington, 2002).
References: Guillermo A. Calvo, 1998, "Growth, Debt and Economic Transformation: The Capital Flight Problem" in New Theories in Growth and Development , ed. by Fabrizio Coricelli, Massimo di Matteo, and Frank Hahn (New York: St. Martin's Press). Daniel Cohen, 1991, Private Lending to Sovereign States: A Theoretical Autopsy (Cambridge, Massachusetts: MIT Press).
——— and Ross Levine, 2001, "What Have We Learned from a Decade of Empirical Research on Growth? It's Not Factor Accumulation: Stylized Facts and Growth Models," World Bank Economic Review, Vol. 15, No. 2 (August), pp. 177�219. Ibrahim Elbadawi, Benno Ndulu, and Njuguna Ndung'u, 1997, "Debt Overhang and Economic Growth in Sub-Saharan Africa," in External Finance for Low-Income Countries, ed. by Zubair Iqbal and Ravi Kanbur (Washington: International Monetary Fund).
|