
Caught in the Web
Finance & Development, September 2012, Vol. 49, No. 3
Network analysis looks at financial connections in a globalized world and the risks they pose

Andrew Haldane, Executive Director for Financial Stability of the Bank of England, once compared the collapse of the investment banking firm Lehman Brothers in late 2008 to a virus outbreak.
Fear that Lehman’s demise would spread caused widespread panic that led to a freeze in borrowing and lending in a number of financial markets—much like the fear of a virus might lead people to avoid contact with one another. The effects of Lehman’s fall were difficult to isolate. In fact, the reach and macroeconomic costs associated with Lehman’s demise were much larger than one could have anticipated based on the size of the initial event alone (Haldane, 2009).
It is not clear what enables relatively small shocks, such as Lehman’s demise, to reverberate through the larger economy and why such shocks are often difficult to isolate. The answer seems to lie with the complexity of the financial connections among agents, institutions, and countries. When unexpected bad events occur (negative shocks, in economic parlance), uncertainty sets in and disrupts economic activity. The failure of Lehman, which many believe sparked the global financial crisis, suggests that some institutions are so central to the financial system that their failure can be catastrophic. Similarly, some countries are so integrated into the global financial system that a negative shock there can reverberate through the entire global economy.
Commentators coined the term “too interconnected to fail” to identify players (financial institutions and countries) that are so caught in the web that they pose a systemic risk—that is, their failure would threaten the stability of the entire financial system. Several years into the crisis, it has become clear that to safeguard financial stability, it is important to understand how interconnectedness can be defined and measured and how it relates to the concept of systemic risk. A methodology that can help do this is network analysis, which is used in epidemiology to investigate the spread of diseases.
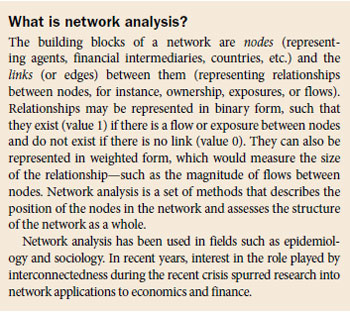
Network analysis looks at the financial system as a set of players connected with one another through financial contracts (see box). For example, the interbank market is a network of banks that lend to each other on a short-term, often overnight, basis. At every point in time, the banks in the network have exposure to each other represented by the total claims or liabilities accumulated through lending and borrowing. There are a number of ways that a bank becomes more important, or central, in the network. It can have borrowing and lending relationships with a large number of banks. It can have claims on other important banks. It can account for an outsized share of the total transactions. It can intermediate flows between many banks that are not directly lending to one other.
There is also a global network of countries that are exposed to each other through capital flows, trade, or migration—or all three. A first step in assessing financial stability using network analysis is to look for patterns in the relationships among players in the financial system. Javier Reyes and I recently mapped banking relationships across countries since the late 1970s through the lens of a network (Minoiu and Reyes, 2011). We asked the following questions: How can the level of financial interconnectedness be assessed globally? Has that interconnectedness changed over time? Was it unusually high before the recent financial crisis? Are there any striking patterns of interconnectedness that may not be visible by simply looking at total flows?
Building the network
To construct a worldwide web of financial connections, which we call the global banking network, we used a unique data set with information on cross-border financial flows intermediated by banking systems in a large sample of countries during 1978–2010. The data set, compiled by the Bank for International Settlements (BIS), is called the BIS locational banking statistics. Financial institutions that report data to the BIS generally include licensed banks and, depending upon the country, large securities firms and offshore banks. They report information on such financial instruments as loans, deposits, and debt securities. The data are compiled on the basis of residence of BIS reporting banks, which makes them well suited for analyzing geographical patterns in financial linkages.
We performed the network analysis on two sets of countries: the core of the network, 15 advanced economies that have reported data to the BIS over a long period of time; and the periphery, 169 countries at various levels of development. The periphery countries in our sample either reported data only in recent years or do not report at all. We restrict the core to the 15 economies that have reported data to the BIS continuously since 1978 so as not to confound changes in the network with changes in the sample of reporting countries.
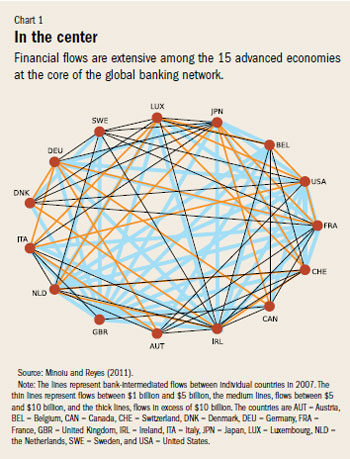
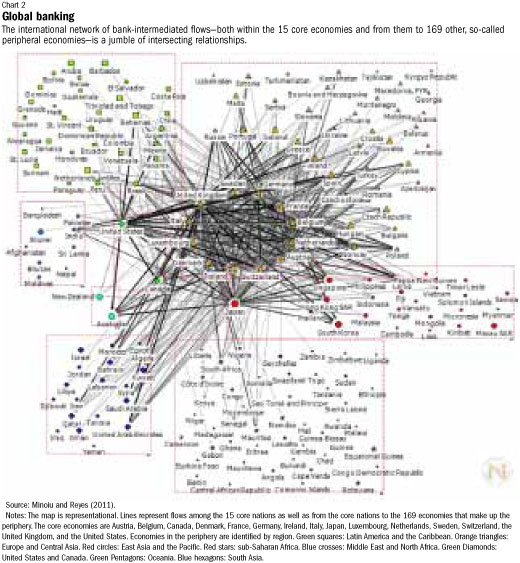
We constructed two networks. The core-core network captures flows among the 15 advanced economies and resembles Chart 1. The core-periphery network captures flows from the 15 advanced economies to the rest of the world (the flows from the rest of the world to the core are not reported). The global banking network is obtained by superimposing the core-core and core-periphery networks and looks like Chart 2. The relationships (links) between countries represent positive financial flows intermediated by banking systems, in other words, net investments. If there is no link between two countries, there was no reported new net flow of bank-intermediated funds from one country to the other.
Connected and clustered
We focused on two simple and widely used connectedness indicators that capture the density of relationships in the global banking network and focus on the presence of a relationship between two countries rather than the magnitude of the financial flow between them—connectivity and clustering.
Connectivity measures the density of bilateral relationships, that is, the number of links between countries in the network divided by the total number of possible links. Clustering gauges the density of three-way relationships—in which a country’s lenders are also lending to each other. It is roughly defined as the number of triangles that appear in the network divided by the total number of possible triangles. In the core-core network, a triangle occurs when three core economies are lending to one another; in the core-periphery network, a triangle occurs when a periphery country is borrowing from two core economies that are lending to each other.
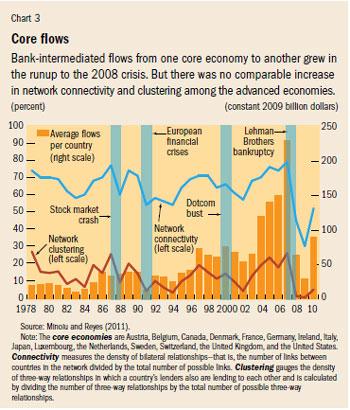
We began by looking at total flows. There is a remarkable increase in the magnitude of bank-intermediated flows to the countries in our sample. Comparing the 1978–2002 average with the precrisis peak, we find that financial flows transferred by banks from one core economy to another amounted to a positive net $36 billion per year on average and reached $230 billion just before the recent crisis (see Chart 3). Similarly, banking flows from the core to the periphery were on average $1.5 billion in the early period and rose to $6.4 billion before the recent crisis (see Chart 4).
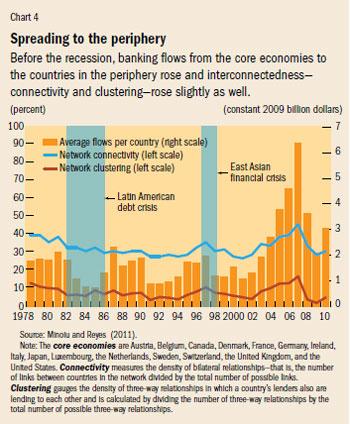
There is not, however, a comparable increase in financial interconnectedness. Like total flows, connectedness rises before financial crises and falls afterward. But connectedness was not unusually high before the recent crisis. In fact, both connectivity and clustering for the core-core network suggest that similar levels of interconnectedness were reached before other financial crises, such as the 1987 stock market crash. The core-periphery network also displays a precrisis increase in connectedness, which likely reflects a secular trend toward higher financial openness in the periphery. Moreover, in either network the increase in the density of relationships among countries before the recent crisis was clearly dwarfed by the unprecedented rise in total flows.
A unique feature of the recent crisis is that in its aftermath, network density fell to the lowest point of the 22-year period. Clustering, the prevalence of trilateral relationships, almost disappeared in both the core-core and core-periphery networks. The crisis appears to have triggered a drop in network density of a magnitude that we had not seen before. But why?
Historically, connectivity and clustering have followed a boom-bust cycle, much like total flows. But this pattern did not hold during the most recent crisis. While network density in 2007 was comparable to the precrisis levels observed earlier, the extent to which it fell in 2008–09 stands out. Although some analysts attributed the severity of the crisis to the level of financial interconnectedness, our findings suggest that the precrisis boom in connectivity can only partially explain the depth of the crisis. We suspect that two additional factors played a role. First, before the crisis, the global banking network was intermediating cross-border flows that were much larger than in previous decades. Second, the initial shock to the financial system was in the core of the global banking network, and within the core the affected participants were themselves highly interconnected. Studies have shown that similar shocks can have different consequences for a financial system depending on the particular point in the network structure where the shock hits (Gai and Kapadia, 2010). The location of the shock, combined with the unusually large cross-border flows of financial instruments, are likely to have been the factors that caused this crisis to be significantly more severe than earlier ones.
A tool for the future
Financial interconnectedness—the pattern of interactions among institutions and countries in the global financial system—is often called the main culprit in the severity of the recent crisis. This is because what was initially thought to be a local shock—the bankruptcy of a highly interconnected financial institution—had consequences well beyond that institution’s and its country’s borders. Had network analysis been in the policymakers’ toolkit, they might better have understood the potential consequences of permitting the failure of a medium-sized financial institution. Network analysis, which looks at agents not in isolation but in concert, provides tools for analyzing interconnections that can be used to assess systemic risk. By looking at agents and the links between them, network analysis can add valuable insights about the financial system as a whole, which is a complicated web of interlinked and interdependent players. ■
References
Gai, Prasanna, and Sujit Kapadia, 2010, “Contagion in Financial Networks,” Proceedings of the Royal Society A, Vol. 466, No. 2120, pp. 2401–2423.
Haldane, Andrew G., 2009, “Rethinking the Financial Network,” Speech delivered at the Financial Student Association Conference in Amsterdam, April 28
Minoiu, Camelia, and Javier A. Reyes, 2011, “A Network Analysis of Global Banking: 1978–2009,” IMF Working Paper 11/74 (Washington: International Monetary Fund).

Write to us
F&D welcomes comments and brief letters, a selection of which are posted under Letters to the Editor. Letters may be edited. Please send your letters to fanddletters@imf.org