IMF Executive Board Concludes the 2019 Article IV Consultation and Request for a Three-Year Policy Coordination Instrument with Rwanda
IMF News, June 29, 2019
Source details
- Canonical URL
- IMF Executive Board Concludes the 2019 Article IV Consultation and Request for a Three-Year Policy Coordination Instrument with Rwanda
Other formats
Bibliographic details
- Published: June 29, 2019
Overview and Program Approval
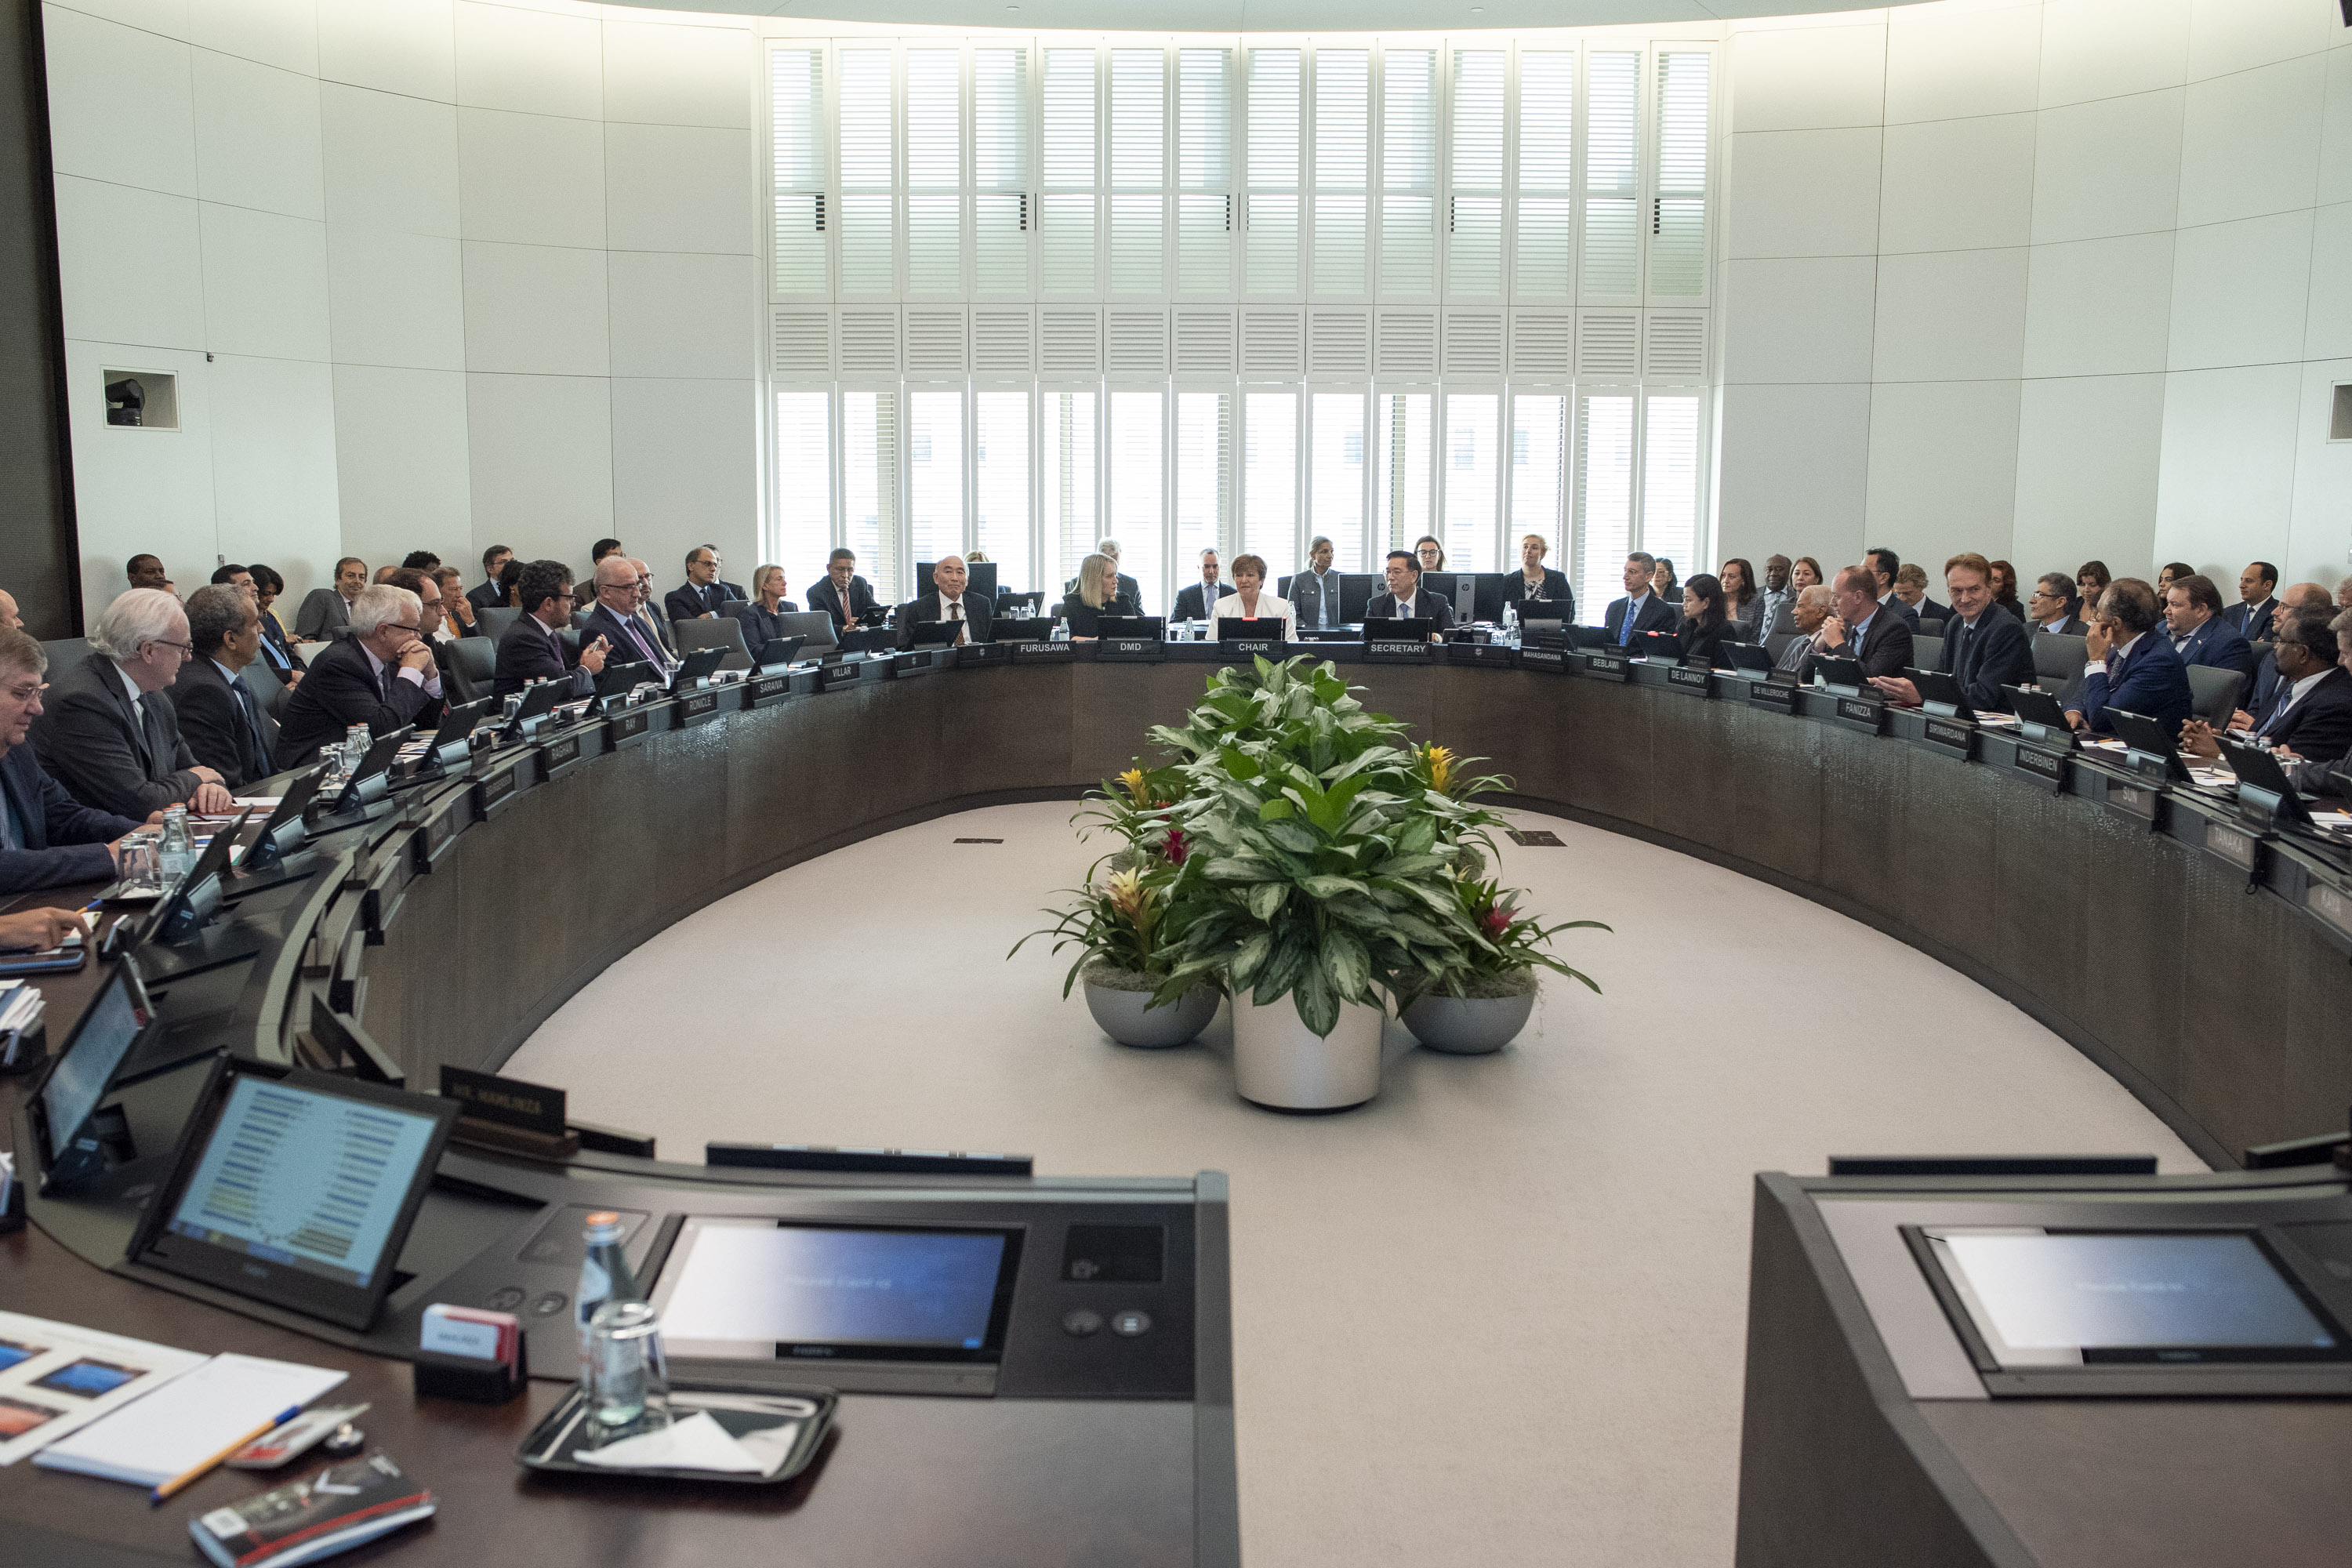
- On June 28, 2019, the Executive Board of the International Monetary Fund concluded the Article IV consultation and approved a new Three-Year Policy Coordination Instrument (PCI) with Rwanda.
- The PCI involves no use of IMF financial resources; successful completion of semi-annual program reviews will help signal Rwanda’s commitment to continued strong macroeconomic policies and structural reforms.
- Program objectives:
- Support implementation of Rwanda’s National Strategy for Transformation (NST).
- Provide an eased fiscal policy stance while maintaining external and debt sustainability.
- Mobilize additional domestic revenue and strengthen public financial management.
- Support the new monetary policy framework and financial sector development.
Recent Economic Developments and Outlook
- Growth:
- Real GDP growth reached 8.6 percent year-on-year in 2018, led by construction and services.
- Projections over the next five years have been revised up, to around 8.0 percent.
- Growth should remain around 8 percent in 2019, supported by public investment spending, private investment, and diversification efforts.
- Inflation and monetary policy:
- Inflation has been below the authorities’ targeted band for several months, prompting the central bank to lower its policy rate in May.
- The National Bank of Rwanda (BNR) is implementing a forward-looking, interest rate-based operational framework; short-term interest rates convergence and nascent transmission to longer-term rates noted.
- External sector:
- The current account deficit is expected to increase in 2019–20 due to airport construction, and decline thereafter.
- Risks:
- Upside risks: acceleration of large public and private investment projects (including peat power plant, tin smelting factory, new energy distribution substations, and construction of new Special Economic Zones) and enhanced regional trade ties.
- Downside risks: lower than expected ODA, variable weather/climate change, commodity price movements, and regional security issues.
- Financing NST:
- Financing the NST will be challenging; initiatives such as the African Continental Free Trade Area and the Compact with Africa should help leverage additional private financing.
Program Pillars and Structural Reforms
- Four main program pillars:
1. Recalibrating fiscal objectives and the medium-term fiscal stance. 2. Bolstering domestic revenues over the medium term. 3. Improving public financial management, notably fiscal risk management and transparency. 4. Supporting the new monetary policy framework, including through financial sector development.
- Monetary operations and market development commitments:
- Strengthen communication and deepen money markets, including by strengthening the repo market.
- Continued active liquidity management to reinforce monetary transmission.
- Structural reform focus:
- Bolster long-term savings.
- Upgrade the national payments system.
- Introduce platforms for broader participation in the government securities market and enhanced interaction across types of financial services providers.
- Renewed focus on the quality of education and private sector-led growth to support Vision 2050 and SDG achievement.
Executive Board Assessment and Policy Messages
- Directors commended Rwanda’s strategic goal-setting, public accountability, and broad ownership of policies that contributed to rapid and inclusive growth and progress toward development objectives.
- Key Director recommendations and views:
- A PCI is appropriate to support continued progress; strong ownership of the reform agenda, donor support, and capacity building are important.
- Support for recalibrating the medium-term fiscal stance to allow more room for priority capital investment and social spending while maintaining a low risk of debt distress; some Directors stressed consistency with EAC fiscal deficit convergence.
- Emphasis on domestic resource mobilization: streamlining tax exemptions, strengthening tax policy capacity, and developing a medium-term revenue strategy.
- Support for strengthening public financial management: identify and mitigate fiscal risks and enhance fiscal transparency.
- Endorsement of the new monetary policy operational framework and support for the recent easing to bring inflation back within target range; further improvements in exchange rate flexibility, liquidity management, forecasting, and communication recommended to strengthen transmission.
- Support for NST’s private sector focus; recognition of challenges in attracting private investment and endorsement of regional and international initiatives (African Continental Free Trade Area, G-20 Compact with Africa) and blended finance to leverage private financing.
Key Economic Indicators (selected, as presented)
- Output and prices:
- Real GDP: 2017: 6.1; 2018: 8.6; 2019: 7.8; 2020: 8.1; 2021: 8.2; 2022: 8.0; 2023: 7.5 (annual percentage change).
- GDP deflator: 2017: 7.3; 2018: -0.8; 2019: 4.2; 2020: 5.0.
- CPI (period average): 2017: 4.8; 2018: 1.4; 2019: 3.5.
- CPI (end period): 2017: 0.7; 2018: 1.1.
- Money and credit:
- Broad money (M3): 2017: 12.4; 2018: 15.6; 2019: 19.8; 2020: 20.0; 2021: 17.7; 2022: 16.9; 2023: 15.9.
- Reserve money: 2017: 8.8; 2018: 16.1; 2019: 17.2; 2020: 17.9; 2021: 15.7; 2022: 14.9; 2023: 14.2.
- Credit to non-government sector: 2017: 13.9; 2018: 10.8; 2019: 12.8; 2020: 14.3; 2021: 13.3; 2022: 13.4.
- M3/GDP (percent): 2017: 23.6; 2018: 25.3; 2019: 27.0; 2020: 28.5; 2021: 29.5; 2022: 30.5; 2023: 31.3.
- NPLs (percent of total gross loans): 2017: 7.6; 2018: 6.4.
- Budgetary central government (Percent of GDP):
- Total revenue and grants: 2017: 22.9; 2018: 24.1; 2019: 23.1; 2020: 22.2; 2021: 21.6; 2022: 22.0.
- of which : tax revenue: 2017: 15.5; 2018: 16.2; 2019: 16.3; 2020: 16.5; 2021: 16.8.
- of which : grants: 2017: 4.7; 2018: 4.9; 2019: 3.9; 2020: 3.4; 2021: 3.6; 2022: 3.7.
- Expenditure: 2017: 27.5; 2018: 28.8; 2019: 29.2; 2020: 28.6; 2021: 27.8; 2022: 27.1.
- Current: 2017: 14.7; 2018: 15.3; 2019: 13.7; 2020: 13.6.
- Capital: 2017: 10.7; 2018: 11.5; 2019: 12.0; 2020: 12.3; 2021: 12.1; 2022: 11.8.
- Primary balance: 2017: -3.6; 2018: -3.5; 2019: -4.9; 2020: -5.0; 2021: -4.8.
- Overall balance: 2017: -4.7; 2018: -6.1; 2019: -6.4; 2020: -6.2; 2021: -5.1.
- excluding grants: 2017: -9.4; 2018: -9.6; 2019: -10.9; 2020: -10.4; 2021: -8.7; 2022: -8.5.
- Net domestic borrowing: 2017: 0.0; 2018: 2.0; 2019: 0.8; 2020: -0.3; 2021: -0.6.
- Public debt:
- Total public debt incl. guarantees: 2017: 48.9; 2018: 53.1; 2019: 55.8; 2020: 57.3; 2021: 58.2; 2022: 57.2; 2023: 56.7.
- of which : external public debt: 2017: 37.9; 2018: 41.6; 2019: 43.4; 2020: 44.6; 2021: 45.5; 2022: 45.6; 2023: 45.8.
- PV of total public debt incl. guarantees: 2017: 41.1; 2018: 42.5; 2019: 42.9; 2020: 42.7; 2021: 41.2.
- Investment and savings:
- Investment: 2017: 23.8; 2018: 24.4; 2019: 27.7; 2020: 28.4; 2021: 28.2; 2022: 27.6.
- Government investment share (2017): 13.1.
- Nongovernment investment share (2017): 12.9.
- Savings: 2017: 11.9; 2018: 14.6; 2019: 16.4; 2020: 18.0; 2021: 17.0; 2022: 18.4.
- External sector:
- Exports (goods and services): 2017: 21.7; 2018: 21.4; 2019: 21.2; 2020: 22.1; 2021: 22.7.
- Imports (goods and services): 2017: 32.5; 2018: 32.7; 2019: 33.6; 2020: 32.8; 2021: 31.8; 2022: 32.0; 2023: 31.7.
- Current account balance (incl grants): 2017: -7.8; 2018: -7.9; 2019: -8.1; 2020: -7.4.
- Current account balance (excl grants): 2017: -11.9; 2018: -11.5; 2019: -13.1; 2020: -12.0; 2021: -10.2; 2022: -10.6.
- Current account balance (excl. large projects): 2017: -9.0; 2018: -8.3.
- Gross international reserves:
- In millions of US$: 2017: 1,163; 2018: 1,319; 2019: 1,428; 2020: 1,566; 2021: 1,637; 2022: 1,726; 2023: 1,867.
- In months of next year's imports: 2017: 4.6.
- Memorandum items:
- GDP at current market prices, Rwanda francs (billion): 2017: 7,600; 2018: 8,189; 2019: 9,199; 2020: 10,442; 2021: 11,866; 2022: 13,460; 2023: 15,197.
- GDP at current market prices, US$ (million): 2017: 9,140; 2018: 9,510.
- GDP per capita (US$): 2017: 774; 2018: 787.
- Population (million): 2017: 12.7; 2018: 13.0.
Press Release No. 19/258 — IMF Communications Department, June 28, 2019.