

Loading component...
Middle East and Central Asia
Middle East and Central Asia
May 2015
 May 2015


Economic activity in the Caucasus and Central Asia (CCA) will continue to decelerate in 2015 mainly as a consequence of lower commodity prices and spillovers from Russia’s slowdown. Where fiscal space and available financing allow, temporary fiscal easing would help economies respond to weakening demand and declining remittances. Over the medium term, fiscal consolidation is needed to rebuild depleted buffers and adjust spending plans to the new regional and global economic context. In light of the depreciation of the ruble and the appreciation of the dollar, greater exchange rate flexibility would ease pressure on reserves while helping oil exporters adjust to lower oil prices. Monetary policy may need to be tightened to keep inflation expectations anchored in the face of weakening currencies. Over the medium term, deep structural reforms, particularly to improve the business climate and governance, would raise prospects and make economic growth more inclusive and diversified.
A modest recovery is expected to continue in the MENAP despite a slump in oil prices, raging regional conflicts, and lingering uncertainty of the post-Arab Spring transitions.
Although rising, economic growth rates remain too low to make a dent into high unemployment across the region, especially among the youth. Raising economic prospects in a sustainable and inclusive manner suggests the need for multifaceted structural reforms.
|
MENAP Oil Exporters | GCC |
Non-GCC Oil Exporters | MENAP Oil Importers | |
| 2014 | ||||
| 2015 | ||||
Government Spending and Rising Oil Production Support Growth
Growth in MENAP oil exporters reached 2.4 percent
in 2014, slightly higher than in 2013, and mainly
reflecting recovery in Iran and a pick-up in oil-related
activity in Saudi Arabia. In 2015, growth is projected
to remain unchanged, before rising to 3½ percent in
2016 as oil growth accelerates in Iraq and Libya.
Although the oil price decline has reduced authorities’
spending power, which has been the engine of the
non-oil economy in recent years, the impact is to be
appropriately cushioned by using the accumulated
financial buffers where available, while gradually
undertaking the needed fiscal adjustment over the
medium term. As a result, growth will be stable this
year, albeit 1½ pp lower than was projected last
October.
- In the GCC countries, growth is forecast at
3.4 percent in 2015, revised downward since last
October by 1 pp, mainly because of a slowdown
in non-oil growth in response to lower oil prices.
In Saudi Arabia, the growth forecast for 2015 is
now 3 percent, down 1½ pp from last October,
although half of this revision owes to the rebasing
of real GDP data.
- Outside the GCC, growth has been revised down
by 2 pp in 2015 to just above 1 percent, as oil
production continues to be hampered by security
disruptions (Libya, Yemen) and a challenging
external environment (Iran). In Iraq, growth is
expected to reach 1¼ percent in 2015 as the oil
economy recovers, although the security situation
and stagnating government spending will
continue to weigh on non-oil activity.
Inflationary Pressures Are Subdued
Inflation in MENAP oil exporters is projected to remain broadly unchanged in 2015. In the GCC, inflat ion is expected to decline by ½ pp to just above 2 percent because of strengthening currencies (pegged to the U.S. dollar) and declining food prices. Lower oil prices are unlikely to affect inflation significantly, because most countries use administered prices for fuel products. In countries with managed exchange rates (Algeria, Iran), currency depreciation may add to inflat ion pressures, while supporting non-oil exports.
Two-Sided Risks
Uncertainty surrounding the projections has
increased. Although most risks are two-sided, their
balance is still tilted to the downside. The current
oversupply in the global oil market suggests that GCC
may face challenges in maintaing market share, with
potential downside pressures on oil production.
Government spending and hence nonoil activity may
slow down by more than expected. However, a fasterthan-
expected recovery in oil prices would support
government spending and nonoil growth. Overall, the
risk of volatility in oil prices has risen, at least in the
short term, because of complex interplays between traditional and shale oil production and geopolitical risks. (For more details on oil market developments
and outlook, see Commodity Market Developments
and Forecasts in the April 2015 WEO [page 28]:
Special Feature: Commodity Market Developments and Forecasts,
with a Focus on Investment in an Era of Low Oil Prices).
Conflicts and geopolitical tensions further augment
the risks. Oil production in countries affected by
conflict (Libya, Iraq) may surprise either on the
upside or downside. Following the release of the key
parameters for a Joint Comprehensive Action Plan
(JCPOA) between Iran and the P5+1 on April 2,1
upside risks to oil production and exports have increased.
The normalization of U.S. monetary policy is expected to tighten financial and monetary conditions in the region, especially in the GCC, although the pass-through tends to be slow and partial. For countries that are highly dependent on foreign funding (Bahrain, Oman, Yemen), financing and rollover risks may rise.
Lower Oil Prices Erode Long-Standing External and Fiscal Surpluses
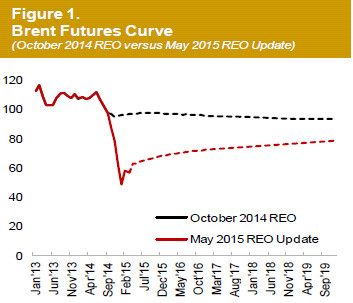
Under the current oil price assumptions, the fall in anticipated oil export earnings in 2015 is $287 billion (21 percent of GDP) in the GCC and $90 billion (11 percent of GDP) in the non-GCC countries (Figure 2). The oil price decline will turn the longstanding current account surplus of MENAP oil exporters into a deficit of $22 billion (1 percent of GDP) in 2015.
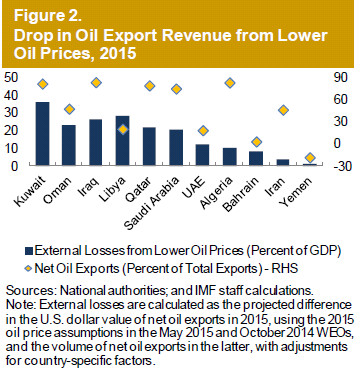
Surpluses are expected to return gradually over the
medium term, reaching 3¼ percent of GDP by 2020,
as a result of both higher oil prices and projected
fiscal consolidat ion (Figure 3).
Fiscal balances are also severely affected by lower oil
prices. In the GCC, a combined budget surplus for
2014 of $76 billion (4½ percent of GDP) is expected
to turn into deficit of $113 billion (8 percent of GDP) in 2015, narrowing only partly over the medium term to 1 percent of GDP (Figure 3). Non-GCC countries
already posted a fiscal deficit in 2014 (4¾ percent of
GDP), which is expected to widen to 9 percent of
GDP in 2015, before stabilizing at 2½ percent of GDP
in the medium term.
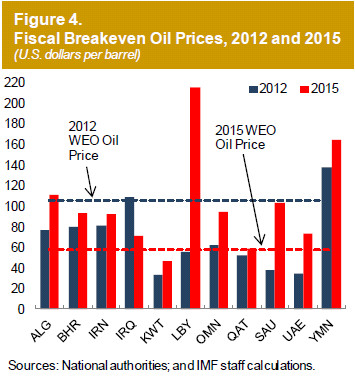
A sharp rise in spending in recent years has made budgets vulnerable to lower oil prices. Most countries in the region cannot balance their budgets when oil prices approach $60 per barrel (Figure 4).
A permanent decline in oil prices reduces the real income of oil exporters and requires fiscal consolidation plans to be brought forward. Non-oil fiscal balances are expected to improve by 2½ pp of non-oil GDP in 2015, driven by Kuwait, Oman, Iraq, and Libya. In the GCC, large buffers and available financing allow the adjustment to be gradual (Table 3
in the January 2015 REO Update). However, most
GCC countries have not yet announced specific
consolidation plans (Table 1).
Outside the GCC, where both oil revenue losses and
fiscal buffers are smaller (Figure 2), non-oil balances
are expected to improve by 2¾ pp of non-oil GDP in
2015, a revision of 1½ pp since last October. In
Libya, capital spending is curtailed because of
difficult security conditions. A moderately looser
fiscal position in Iran (by 1 percent in 2015) reflects
lower oil prices and planned increases in capital
spending.
(as of end-March 2015) | |
GCC | |
| Bahrain | Authorities announced increase in natural gas prices for industrial users (+11%) and employee medical insurance fees (paid by employers) in early 2015. |
| Kuwait | The 2015/16 budget projects an 18% cut in public spending, capital spending to be shielded. |
| Oman | The 2015 budget includes reduction in defense spending, capital spending shielded. |
| Qatar | No major announced policy response. Qatar continues its policy of restraining current expenditures. |
| Saudi Arabia | A large fiscal spending package worth around 4 percent of GDP was announced in Feb 2015. |
| UAE | No major announced policy response. UAE continues its path of gradual fiscal consolidation. |
non-GCC | |
| Algeria | Public sector hiring freeze was announced. |
| Iran | The 2015/16 budget aims to limit drop in oil revenue by: (i) increasing the share of oil exports that goes to the budget, (ii) depreciating the official exchange rate (by 10%). |
| Iraq | The 2015 budget includes increases in non-oil taxes and aims to contain spending (e.g., savings on civil servant wages). |
| Libya | No major policy response announced. |
| Yemen | Large decline in energy subsidies planned for 2015H1. Increase in Social Welfare Fund transfers to poor by 50% (Dec 2014). Progress in implementation will depend on security situation. |
Source: Authorities and IMF staff. | |
Opportunities for Fiscal Reform
Because government spending is a key driver of nonoil growth, fiscal consolidation should be done in a growth-friendly manner. This can be achieved by limit ing spending overruns and slowing the growth of public wage bills and other current expenditures and ensuring the productivity of capital spending.
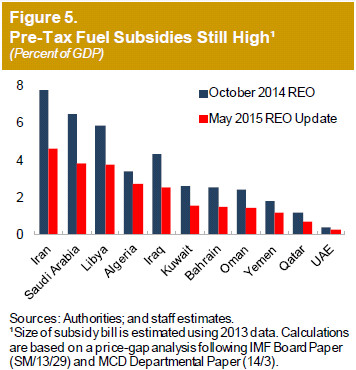
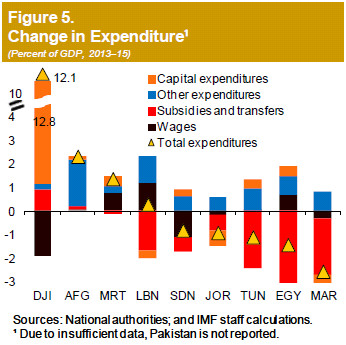
Reducing generalized energy subsidies—which remain large despite lower oil prices (Figure 5)— while increasing targeted social subsidies, would also help raise government revenues and discourage inefficient use of energy. Delaying such reforms will most likely require a more abrupt and costly adjustment in the future. Most countries have already initiated reforms to their subsidy systems (Table 2).
Lower oil prices underscore the benefits of reducing countries’ dependence on oil. Increasing the efficiency of capital expenditure by prioritizing and raising oversight and transparency of projects, improving tax administration, and increasing non-oil revenue collection would complement efforts to contain spending.
GCC | |
| Bahrain | Authorities announced increase in natural gas prices for industrial users (+11%) and employee medical insurance fees (paid by employers) in early 2015. |
| Kuwait | In Jan-15, government raised diesel and kerosene prices (+50%) and instituted monthly price review mechanism. |
| Oman | No reform measures recently announced. |
| Qatar | Diesel prices up in May-14 by 50%. Starting to improve desalination technologies and awareness of sustainable energy use. |
| Saudi Arabia | No reform measures recently announced. |
| UAE | Gasoline price highest in GCC (still below int'l levels). Abu Dhabi increased water (+170%) and electricity (+40%) tariffs in Jan-15. |
non-GCC | |
| Algeria | Authorities published cost of implicit subsidies in budget for first time in 2014. |
| Iran | Fuel prices were increased in Mar/Apr-14 by about 30 percent. Similar increase is possible in 2015. |
| Iraq | No reform measures recently announced.. |
| Libya | Two initiatives being piloted: (i) use of national ID to eliminate duplication, (ii) reduce number of subsidized food items. |
| Yemen | Increase in gasoline, diesel, and kerosene prices in 2014 by 20%, 50%, and 100%, respectively. Automatic fuel price adjustment mechanism planned for first half of 2015. |
Source: Authorities and IMF staff. | |
Banks Are Sound but Face Higher Risks
The oil price decline has affected financial markets in MENAP oil exporters. Equity prices have declined, and volatility has risen. Real estate markets are showing signs of cooling.
GCC banks are expected to remain sound despite the sharp decline in oil prices and slowing loan growth, because they have strong initial financial positions. They will also be supported by continuing government infrastructure investment—albeit at a lower pace—which drives nonoil growth, bank credit, and profitability. Liquidity could tighten as oil-related bank deposits decline, and NPLs could rise. However, banks are well positioned to absorb the shocks.
By contrast, non-GCC banks are more vulnerable. Iran’s banking system is already exhibiting systemwide stress, on the back of high NPLs, because of a weaker economic environment and the withdrawal of correspondent banks in response to sanctions. In Yemen, large exposures to the government, against the backdrop of a weak fiscal position, declining oil revenues, and the escalating conflict has raised systemic risks. In Iraq, the deteriorating polit ical and economic environment is exerting pressure on an already weak banking system.
Diversification Is More Urgently Needed
New realities of the global oil market make more urgent the need to move away from the past growth models based on oil-driven government spending and sharing of oil wealth through subsidies and public employment for nationals. These models have led to low productivity growth and are not deliver ing adequately on jobs and diversification.2
A new model is needed where economic growth and job creation are driven by a diversified private sector. Creating incentives for private entrepreneurship in the tradable goods sectors, improving the match between education and skills required by the private sector, and increasing private employment of nationals would go a long way toward achieving the diversification goals.
Notes
1 P5+1 are the five permanent members of the UN Security
Council and Germany. The key parameters are expected to
serve as the basis for a final JCPOA to be completed by
end-June, 2015, which aims for commitments regarding
Iran’s nuclear program in exchange for economic sanctions
relief. Projections presented in this REO Update do not
incorporate the impact of sanctions relief on the economy,
as details of these are yet to be agreed.
2 The contribution of productivity to potential growth was 2
pp lower in MENAP oil exporters than in other emerging
market and developing countries during 2008–2014 (see
Annex I of the October 2014 REO).
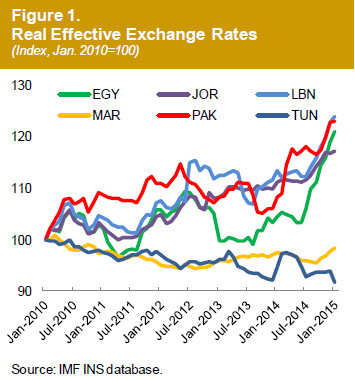
In 2014, economic activity was weighed down by disappointing export growth, security concerns, and unresolved supply-side bottlenecks. Exports were adversely affected by weak euro area growth (the Maghreb’s key trading partner) and deteriorating competitiveness. Real exchange rates appreciated (Figure 1) as nominal exchange rates appreciated against the euro, on the back of a strengthening U.S. dollar, against which some countries peg their currencies. Security risks discouraged tourism (Egypt, Lebanon) and coupled with spillovers from regional conflicts (Iraq, Libya, Gaza, Syria) hurt confidence. Developments in Iraq and Syria also resulted in large refugee flows and trade disruptions in Jordan and Lebanon and exacerbated the political impasse in Lebanon. Electricity supply disruptions (Egypt, Lebanon, Pakistan) and limited access to bank credit added to headwinds from weak confidence, taking a toll on private sector sentiment. Lower oil prices, due to their appearance late in the year and slow passthrough to local fuel prices, had little effect on reducing production costs and increasing disposable incomes.
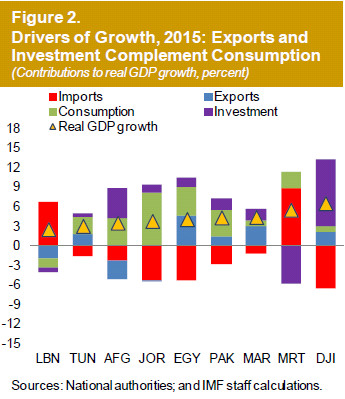
Economic growth is projected to strengthen by 1 pp to 4 percent in 2015 (Figure 2). Exports are anticipated to rise in line with the gradual recovery expected in the euro area. Domestic demand growth is also likely to pick up owing to already initiated monetary easing (Jordan, Morocco), less drag from fiscal consolidation, and increased government spending on growth-enhancing investment in infrastructure, health, and education. Signs of improving confidence have emerged, including falling risk premiums, stock market gains, and a pick-up in credit growth. Confidence is also benefitting from last year’s advances in political transitions, through elections and new constitutions. Many governments—now backed by multiyear horizons—are undertaking difficult structural reforms. These should help reduce supplyside impediments (including energy shortages), further supporting investment and exports, and countering real exchange rate appreciation pressures. Lower oil prices are likely to support confidence by helping ease fiscal and external vulnerabilities. However, given the limited pass through to retail prices across the region as a whole, its direct impact on growth may be modest and offset by intensifying security risks and spillovers from conflicts. Consumption will continue being supported by remittance inflows, public wage spending, and, in some cases, subsidies.
Elevated Inflation Gradually Declining
Inflation is set to decline sharply in 2015—by 2½ pp to 7 percent—largely owing to lower food prices and still large negative output gaps. For most of the region, pass-through of lower international oil prices is weak and energy subsidy phase-outs and currency depreciation will exert some upward pressures. In some cases, the removal of energy subsidies, monetization of fiscal deficits, accommodative monetary policies, and last year’s nominal exchange rate depreciation against the U.S. dollar (Sudan, Tunisia) could sustain inflationary pressures.
Risks Tilted to the Downside
Downside regional and domestic risks dominate. Intensified security and social tensions, accompanied by larger spillovers to neighboring countries and setbacks in political transitions and reform implementat ion could further undermine trade, confidence, and macroeconomic stability.
External risks are also tilted to the downside. Lowerthan- expected growth in the euro area, the GCC, or emerging markets could slow tourism, exports, remittances, and financing support. Pass-through from expected increases in U.S. interest rates is estimated to be partial and slow because of MENAP oil importers’ limited global financial integration. A weakening of competitiveness might lead to negative surprises in export growth. On the upside, a greater-than-expected windfall from lower oil prices or a faster recovery in the euro area could bolster growth.
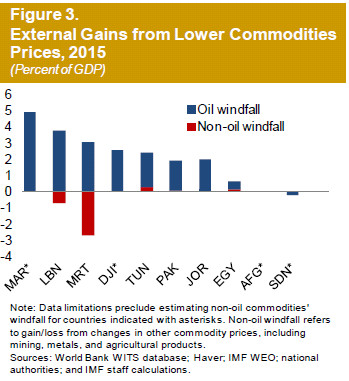
Cheaper Oil Reduces Vulnerabilities
Lower oil prices are expected to help reduce external and fiscal vulnerabilit ies this year. Although benefits from reduced oil import bills are partially offset by declining nonoil commodity export prices (Figure 3), net external gains are still substantial, estimated at $16 billion (1½ percent of GDP) for 2015.
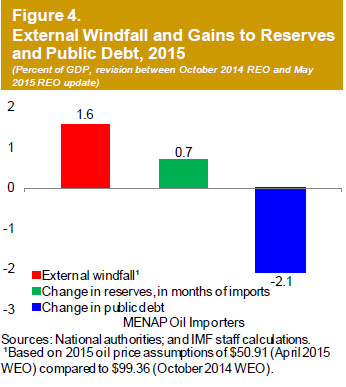
These gains are expected to be mostly saved by the public and private sectors, improving current account balances by ½ pp of GDP and international reserves by ¾ months of imports in 2015 (Figure 4).
Where pass-through to domestic fuel prices is relatively strong and fast (Lebanon, Pakistan), precautionary saving in response to uncertainty about the duration of the oil price shock and uncertainties amid continuing political transitions, is likely to cause households and firms to save most of the income gains resulting from lower oil prices. The boost to private consumption and investment from the remaining gains across the region is expected to be offset by the negative confidence effects of intensifying security concerns and regional spillovers.
In countries where pass-through to local fuel prices is weak because of remaining subsidies or low competition, gains from lower oil prices will accrue mostly to state-owned energy enterprises. Like private firms, such enterprises are likely to save most of the gains, especially given deep-rooted weaknesses in their balance sheets. Budgetary savings from lower energy subsidies (estimated at ½ percent of GDP in 2015) will mainly benefit countries where subsidies remain in place (for instance, Egypt, Tunisia, Sudan). Reflecting the significance of such fiscal and quasifiscal savings, projections of public debt for 2015 have been lowered by 2 pp of GDP from the last October REO to 75 percent of GDP.
Fiscal Consolidation Further Eases Vulnerabilities
Subsidy reforms have helped halt the deterioration of fiscal deficits, which declined by 1½ percentage points to just below 8 percent of GDP in 2014. The largest savings came from lower energy subsidy bills (Figure 5). Subsidy reforms created space for increasing targeted social assistance and transfers as well as spending on education and healthcare. Wage bills and capital spending were broadly unchanged, except in Egypt where increases in both categories were financed largely by GCC grants. Fiscal consolidation, along with lower energy bills in the last quarter of 2014, helped narrow current account deficits and strengthen external buffers. International reserves rose by 12 billion dollars from 4½ months of imports to more than 5 months of imports in 2014. Nonetheless, reserves coverage remains low — around three months of imports — in the region’s largest economies, Egypt and Pakistan.
Governments are expected to continue to consolidate their fiscal positions in 2015, with a new focus on revenue measures. Fiscal deficits are expected to decline by another 1 percentage point of GDP to 7 percent of GDP this year. Increased revenues will complement ongoing spending cuts. A new policy emphasis on tax revenue measures—including eliminat ing exemptions, addressing loopholes, strengthening administration, and introducing income tax reforms (Jordan) and a VAT (Egypt)—will contribute. Lebanon and Pakistan have also raised taxes on fuel products. In some cases higher revenues and savings from energy subsidy reforms2 will be partly channeled into higher spending on infrastructure, education, and healthcare. Progress in consolidation, including by saving part of the windfall from lower oil prices, should help bolster confidence and increase the availability of bank credit for private investment, offsetting some of its drag on growth.
Despite declining fiscal deficits, government financing continues to burden the banking system. High concentration of bank loans among the government and state-owned enterprises presents a risk to banking stability, even though banks are generally wellcapitalized, profitable, and liquid, and high nonperforming loans have broadly stabilized.
Macroeconomic Policy to Balance Growth and Stability Objectives
Since fiscal and external sustainability remains a concern across the region, gains from lower oil prices should largely be used to strengthen buffers and reduce public debt. Lower oil prices also provide an opportunity to bolster these efforts with further removal of costly and inefficient energy subsidies—which benefit the rich (Egypt, Tunisia, Sudan)—and introduction of automatic fuel price adjustment mechanisms. In cases where buffers are already strong, the windfall and savings from subsidy reforms should be used to support growth-enhancing spending which would also boost domestic demand. However, given uncertainty over the persistence of low oil prices, countries should avoid entering into irreversible spending commitments such as increases in public sector wage spending.
Rising international reserves and declining inflation create favorable conditions to increasing exchange rate flexibility and easing monetary policy to support the recovery. Accommodative monetary policies would also soften the adverse impact of fiscal consolidat ion on domestic demand growth. However, prudence is needed when applied in conjunction with exchange rate depreciation or when inflation remains in double digits.
Notes
1 Afghanistan, Djibouti, Egypt, Jordan, Lebanon,
Mauritania, Morocco, Pakistan, Sudan, and Tunisia.
2 See details of recent reforms in the October 2014 REO.
| Average | Projections |
||||||
| 2000–10 | 2011 | 2012 | 2013 | 2014 | 2015 | 2016 | |
| MENAP 1 | |||||||
| Real GDP (annual growth) | 5.3 | 4.4 | 4.8 | 2.4 | 2.6 | 2.9 | 3.8 |
| Current Account Balance | 9.1 | 13.0 | 12.3 | 9.8 | 6.4 | -1.9 | -0.1 |
| Overall Fiscal Balance | 3.5 | 1.9 | 3.0 | 0.4 | -2.3 | -7.9 | -5.2 |
| Inflation, p.a. (annual growth) | 7.0 | 9.3 | 10.1 | 10.0 | 6.9 | 6.1 | 6.3 |
| MENAP oil exporters | |||||||
| Real GDP (annual growth) | 5.5 | 5.3 | 5.7 | 2.1 | 2.4 | 2.4 | 3.5 |
| Current Account Balance | 13.2 | 18.1 | 18.2 | 14.7 | 10.0 | -1.0 | 1.7 |
| Overall Fiscal Balance | 7.7 | 6.0 | 8.1 | 5.0 | 0.3 | -8.4 | -5.0 |
| Inflation, p.a. (annual growth) | 7.2 | 8.9 | 10.4 | 10.4 | 5.8 | 5.8 | 6.1 |
| Of Which: Gulf Cooperation Council | |||||||
| Real GDP (annual growth) | 5.5 | 8.8 | 5.4 | 3.6 | 3.6 | 3.4 | 3.2 |
| Current Account Balance | 15.8 | 23.6 | 24.4 | 20.6 | 16.5 | 2.8 | 5.4 |
| Overall Fiscal Balance | 12.4 | 12.4 | 15.1 | 12.1 | 4.6 | -7.9 | -3.6 |
| Inflation, p.a. (annual growth) | 2.9 | 3.0 | 2.4 | 2.8 | 2.6 | 2.1 | 2.5 |
| MENAP oil importers | |||||||
| Real GDP (annual growth) | 5.0 | 2.4 | 2.9 | 3.1 | 3.0 | 4.0 | 4.4 |
| Current Account Balance | -1.6 | -3.4 | -6.2 | -5.1 | -4.0 | -4.3 | -4.5 |
| Overall Fiscal Balance | -5.0 | -7.1 | -8.3 | -9.5 | -7.9 | -7.0 | -5.6 |
| Inflation, p.a. (annual growth) | 6.5 | 10.2 | 9.3 | 9.1 | 9.4 | 6.9 | 6.5 |
| MENA 1 | |||||||
| Real GDP (annual growth) | 5.4 | 4.5 | 4.9 | 2.3 | 2.4 | 2.7 | 3.7 |
| Current Account Balance | 9.9 | 14.0 | 13.4 | 10.7 | 7.0 | -2.0 | 0.0 |
| Overall Fiscal Balance | 4.4 | 3.0 | 4.3 | 1.5 | -2.0 | -8.4 | -5.4 |
| Inflation, p.a. (annual growth) | 6.9 | 8.8 | 10.0 | 10.3 | 6.7 | 6.3 | 6.5 |
| MENA oil importers | |||||||
| Real GDP (annual growth) | 5.1 | 1.7 | 1.9 | 2.7 | 2.5 | 3.9 | 4.3 |
| Current Account Balance | -2.0 | -5.2 | -8.4 | -7.2 | -5.5 | -5.8 | -6.0 |
| Overall Fiscal Balance | -5.5 | -7.4 | -8.6 | -10.5 | -9.8 | -8.5 | -6.8 |
| Inflation, p.a. (annual growth) | 6.0 | 8.5 | 8.6 | 10.1 | 10.0 | 8.2 | 7.7 |
Sources: National authorities; and IMF staff calculations and projections. 12011–16 data exclude Syrian Arab Republic. Notes: Data refer to the fiscal year for the following countries: Afghanistan (March 21/March 20) until 2011, and December 21/December 20 thereafter, Iran (March 21/March 20), Qatar (April/March), and Egypt and Pakistan (July/June). MENAP Oil exporters: Algeria, Bahrain, Iran, Iraq, Kuwait, Libya, Oman, Qatar, Saudi Arabia, the United Arab Emirates, and Yemen. Gulf Cooperation Council (GCC): Bahrain, Kuwait, Oman, Qatar, Saudi Arabia, and the United Arab Emirates. Non-GCC oil-exporting countries: Algeria, Iran, Iraq, Libya, and Yemen. MENAP Oil importers: Afghanistan, Djibouti, Egypt, Jordan, Lebanon, Mauritania, Morocco, Pakistan, Sudan, Syria, and Tunisia. MENA: MENAP excluding Afghanistan and Pakistan. |
|||||||
| MENAP Oil Exporters: Selected Economic Indicators | |||||||
| Average |
Projections | ||||||
| 2000–10 | 2011 | 2012 | 2013 | 2014 | 2015 | 2016 | |
|
Real GDP Growth |
5.5 | 5.3 | 5.7 | 2.1 | 2.4 | 2.4 | 3.5 |
|
(Annual change; percent) |
|||||||
|
Algeria |
3.9 | 2.8 | 3.3 | 2.8 | 4.1 | 2.6 | 3.9 |
|
Bahrain |
5.5 | 2.1 | 3.4 | 5.3 | 4.7 | 2.7 | 2.4 |
|
Iran, I.R. of |
5.3 | 3.7 | -6.6 | -1.9 | 3.0 | 0.6 | 1.3 |
|
Iraq |
… | 7.5 | 13.9 | 6.6 | -2.4 | 1.3 | 7.6 |
|
Kuwait |
4.8 | 9.6 | 6.6 | 1.5 | 1.3 | 1.7 | 1.8 |
|
Libya |
4.6 | -62.1 | 104.5 | -13.6 | -24.0 | 4.6 | 17.7 |
|
Oman |
3.6 | 4.1 | 5.8 | 4.7 | 2.9 | 4.6 | 3.1 |
|
Qatar |
12.7 | 13.0 | 6.0 | 6.3 | 6.1 | 7.1 | 6.5 |
|
Saudi Arabia |
5.1 | 10.0 | 5.4 | 2.7 | 3.6 | 3.0 | 2.7 |
|
United Arab Emirates |
4.8 | 4.9 | 4.7 | 5.2 | 3.6 | 3.2 | 3.2 |
|
Yemen |
4.5 | -12.7 | 2.4 | 4.8 | -0.2 | -2.2 | 3.6 |
|
Consumer Price Inflation |
7.2 | 8.9 | 10.4 | 10.4 | 5.8 | 5.8 | 6.1 |
(Year average; percent) |
|||||||
|
Algeria |
3.3 | 4.5 | 8.9 | 3.3 | 2.9 | 4.0 | 4.0 |
|
Bahrain |
1.6 | -0.4 | 2.8 | 3.3 | 2.5 | 2.1 | 1.5 |
|
Iran, I.R. of |
14.5 | 21.5 | 30.5 | 34.7 | 15.5 | 16.5 | 17.0 |
|
Iraq |
20.7 | 5.6 | 6.1 | 1.9 | 2.2 | 3.0 | 3.0 |
|
Kuwait |
3.1 | 4.9 | 3.2 | 2.7 | 2.9 | 3.3 | 3.6 |
|
Libya |
3.8 | 15.9 | 6.1 | 2.6 | 2.8 | 2.2 | 4.4 |
|
Oman |
2.6 | 4.0 | 2.9 | 1.2 | 1.0 | 1.0 | 2.6 |
|
Qatar |
5.0 | 1.9 | 1.9 | 3.1 | 3.0 | 1.8 | 2.7 |
|
Saudi Arabia |
1.8 | 3.7 | 2.9 | 3.5 | 2.7 | 2.0 | 2.5 |
|
United Arab Emirates |
5.1 | 0.9 | 0.7 | 1.1 | 2.3 | 2.1 | 2.3 |
|
Yemen |
11.0 | 19.5 | 9.9 | 11.0 | 8.2 | 8.1 | 7.5 |
|
General Gov. Overall Fiscal Balance |
7.7 | 6.0 | 8.1 | 5.0 | 0.3 | -8.4 | -5.0 |
|
(Percent of GDP) | |||||||
|
Algeria |
5.2 | -1.2 | -4.1 | -1.8 | -6.8 | -12.9 | -10.0 |
|
Bahrain1 |
0.4 | -1.5 | -3.2 | -4.3 | -5.7 | -9.9 | -6.2 |
|
Iran, I.R. of2 |
2.5 | -1.3 | -1.9 | -2.2 | -1.8 | -2.7 | -2.3 |
|
Iraq |
… | 4.7 | 4.1 | -5.8 | -3.0 | -10.0 | -6.3 |
|
Kuwait1 |
27.6 | 33.9 | 35.5 | 34.9 | 25.5 | 6.2 | 12.9 |
|
Libya |
14.0 | -15.9 | 27.8 | -4.0 | -43.5 | -68.2 | -43.3 |
|
Oman1 |
9.6 | 9.4 | 4.7 | 3.2 | -1.5 | -14.8 | -11.6 |
|
Qatar |
9.2 | 10.2 | 14.2 | 20.5 | 14.5 | 5.6 | 1.9 |
|
Saudi Arabia |
10.8 | 12.0 | 14.7 | 8.7 | -0.5 | -14.2 | -8.1 |
|
United Arab Emirates3 |
11.6 | 6.3 | 10.9 | 9.9 | 6.0 | -3.0 | 0.0 |
|
Yemen |
-2.2 | -4.5 | -6.3 | -6.9 | -4.1 | -5.3 | -5.1 |
|
Current Account Balance |
13.2 | 18.1 | 18.2 | 14.7 | 10.0 | -1.0 | 1.7 |
|
(Percent of GDP) | |||||||
|
Algeria |
14.5 | 9.9 | 5.9 | 0.4 | -4.3 | -15.7 | -13.2 |
|
Bahrain |
5.9 | 11.2 | 7.2 | 7.8 | 5.3 | -2.1 | -0.7 |
|
Iran, I.R. of |
5.4 | 10.5 | 6.3 | 7.4 | 3.8 | 0.8 | 1.2 |
|
Iraq |
… | 12.0 | 6.7 | 1.3 | -3.5 | -9.6 | -3.6 |
|
Kuwait |
30.7 | 42.7 | 45.2 | 39.6 | 35.3 | 15.7 | 19.3 |
|
Libya |
25.4 | 9.1 | 29.1 | 13.6 | -30.1 | -52.8 | -30.9 |
|
Oman |
8.7 | 13.2 | 10.3 | 6.6 | 2.2 | -15.0 | -13.0 |
|
Qatar |
19.1 | 30.6 | 32.6 | 30.8 | 25.1 | 8.4 | 5.0 |
|
Saudi Arabia |
15.6 | 23.7 | 22.4 | 17.8 | 14.1 | -1.0 | 3.7 |
|
United Arab Emirates |
11.7 | 14.7 | 18.5 | 16.1 | 12.1 | 5.3 | 7.2 |
|
Yemen |
0.7 | -3.0 | -1.7 | -3.1 | -1.6 | -2.2 | -1.5 |
Sources: National authorities; and IMF staff estimates and projections. Note: Variables reported on a fiscal year basis for Iran (March 21/March 20) and Qatar (April/March) 1Central government. 2Central government and National Development Fund excluding Targeted Subsidy Organization. 3Central and state governments. Central government includes budgetary central government, extra-budgetary funds, and social security funds. |
|||||||
| Average |
Projections | ||||||
| 2000–10 | 2011 | 2012 | 2013 | 2014 | 2015 | 2016 | |
|
Real GDP Growth |
5.0 | 2.4 | 2.9 | 3.1 | 3.0 | 4.0 | 4.4 |
|
(Annual change; percent) |
|||||||
|
Afghanistan, Rep. of |
… | 6.5 | 14.0 | 3.7 | 1.5 | 3.5 | 4.9 |
|
Djibouti |
3.5 | 4.5 | 4.8 | 5.0 | 6.0 | 6.5 | 7.0 |
|
Egypt1 |
5.0 | 1.8 | 2.2 | 2.1 | 2.2 | 4.0 | 4.3 |
|
Jordan |
6.1 | 2.6 | 2.7 | 2.8 | 3.1 | 3.8 | 4.5 |
|
Lebanon |
5.1 | 0.9 | 2.8 | 2.5 | 2.0 | 2.5 | 2.5 |
|
Mauritania |
4.5 | 4.4 | 6.0 | 5.7 | 6.4 | 5.5 | 6.7 |
|
Morocco |
4.6 | 5.0 | 2.7 | 4.4 | 2.9 | 4.4 | 5.0 |
|
Pakistan |
4.5 | 3.6 | 3.8 | 3.7 | 4.1 | 4.3 | 4.7 |
|
Sudan2 |
7.3 | -1.2 | -3.5 | 3.7 | 3.4 | 3.3 | 3.9 |
|
Syrian Arab Republic3 |
4.3 | … | … | … | … | … | … |
|
Tunisia |
4.4 | -1.9 | 3.7 | 2.3 | 2.3 | 3.0 | 3.8 |
|
West Bank and Gaza4 |
3.3 | 11.2 | 6.9 | 1.9 | -0.8 | 0.9 | 4.2 |
|
Consumer Price Inflation |
6.5 | 10.2 | 9.3 | 9.1 | 9.4 | 6.9 | 6.5 |
|
(Year average; percent) |
|||||||
|
Afghanistan, Rep. of |
… | 11.8 | 6.4 | 7.4 | 4.6 | 3.7 | 5.5 |
|
Djibouti |
3.5 | 5.1 | 3.7 | 2.4 | 2.9 | 3.0 | 3.5 |
|
Egypt1 |
7.9 | 10.1 | 7.1 | 9.5 | 10.1 | 9.8 | 10.1 |
|
Jordan |
3.8 | 4.2 | 4.5 | 4.8 | 2.9 | 1.2 | 2.5 |
|
Lebanon |
2.6 | 5.0 | 6.6 | 4.8 | 1.9 | 1.1 | 2.8 |
|
Mauritania |
6.3 | 5.7 | 4.9 | 4.1 | 3.5 | 4.5 | 4.6 |
|
Morocco |
1.8 | 0.9 | 1.3 | 1.9 | 0.4 | 1.5 | 2.0 |
|
Pakistan |
7.4 | 13.7 | 11.0 | 7.4 | 8.6 | 4.7 | 4.5 |
|
Sudan2 |
9.1 | 18.1 | 35.5 | 36.5 | 36.9 | 19.0 | 10.5 |
|
Syrian Arab Republic3 |
4.9 | … | … | … | … | … | … |
|
Tunisia |
1.5 | 3.5 | 5.1 | 5.8 | 4.9 | 5.0 | 4.1 |
|
West Bank and Gaza4 |
4.0 | 2.9 | 2.8 | 1.7 | 1.7 | 1.6 | 2.6 |
|
General Gov. Overall Fiscal Balance |
-5.0 | -7.1 | -8.3 | -9.5 | -7.9 | -7.0 | -5.6 |
|
(Percent of GDP) |
|||||||
|
Afghanistan, Rep. of5 |
… | -0.6 | 0.2 | -0.6 | -2.2 | -0.1 | -0.6 |
|
Djibouti |
-2.1 | -1.0 | -2.6 | -5.4 | -12.0 | -13.1 | -12.5 |
|
Egypt1 |
-7.3 | -9.8 | -10.5 | -14.1 | -13.6 | -11.8 | -9.4 |
|
Jordan5 |
-4.2 | -5.7 | -8.9 | -11.1 | -10.3 | -2.9 | -1.5 |
|
Lebanon5 |
-12.7 | -5.9 | -8.4 | -8.7 | -7.1 | -9.1 | -8.6 |
|
Mauritania5,6 |
-3.4 | 0.0 | 2.5 | -0.9 | -3.6 | -1.3 | -1.4 |
|
Morocco5 |
-3.7 | -6.7 | -7.4 | -5.2 | -4.9 | -4.3 | -3.5 |
|
Pakistan7 |
-3.9 | -6.9 | -8.4 | -8.1 | -4.7 | -4.7 | -3.8 |
|
Sudan2 |
-1.2 | 0.2 | -3.3 | -2.3 | -1.0 | -1.5 | -1.4 |
|
Syrian Arab Republic3 |
-2.7 | … | … | … | … | … | … |
|
Tunisia8 |
-2.4 | -3.2 | -4.8 | -6.0 | -3.8 | -5.1 | -3.4 |
|
West Bank and Gaza4 |
-27.6 | -15.8 | -15.1 | -12.5 | -12.1 | -15.1 | -14.0 |
|
Current Account Balance |
-1.6 | -3.4 | -6.2 | -5.1 | -4.0 | -4.3 | -4.5 |
|
(Percent of GDP) | |||||||
|
Afghanistan, Rep. of |
… | 6.4 | 6.3 | 7.5 | 5.7 | 3.1 | 0.5 |
|
Djibouti |
-6.2 | -13.7 | -20.3 | -23.3 | -27.4 | -28.7 | -23.2 |
|
Egypt1 |
0.9 | -2.6 | -3.9 | -2.4 | -0.8 | -3.3 | -4.3 |
|
Jordan |
-4.5 | -10.2 | -15.2 | -10.3 | -7.0 | -7.6 | -6.6 |
|
Lebanon |
-13.9 | -15.1 | -24.3 | -26.7 | -24.9 | -22.2 | -21.7 |
|
Mauritania |
-13.1 | -6.0 | -26.5 | -24.8 | -27.6 | -14.6 | -21.9 |
|
Morocco |
0.1 | -8.0 | -9.7 | -7.6 | -5.9 | -4.2 | -4.0 |
|
Pakistan |
-1.3 | 0.1 | -2.1 | -1.1 | -1.2 | -1.3 | -1.4 |
|
Sudan2 |
-5.3 | -0.4 | -9.3 | -8.6 | -5.1 | -4.0 | -3.6 |
|
Syrian Arab Republic3 |
-0.4 | … | … | … | … | … | … |
|
Tunisia |
-3.0 | -7.4 | -8.2 | -8.3 | -8.9 | -6.4 | -5.2 |
|
West Bank and Gaza4 |
-19.0 | -19.8 | -16.2 | -13.0 | -19.9 | -19.7 | -20.6 |
Sources: National authorities; and IMF staff estimates and projections. |
|||||||
External Shocks Weaken Growth
Economic growth in the CCA declined by 1¼ percentage points (pp) to 5¼ percent in 2014 in part driven by lower commodity prices (in the latter half the year) and economic slowdown in Russia, which has close linkages with the region through remittances, trade, and foreign direct investment.
With a sharp decline in oil prices and expected contraction of Russia’s economy in 2015, the CCA outlook is projected to weaken further (Figure 1). Growth is expected to decline by another 2 pp this year, to 3¼ percent, a downward revision of 2½ pp from the October 2014 REO.

In the CCA oil exporters, the impact from lower oil prices and Russia’s contraction is being amplified by a slowdown in domestic oil production (Kazakhstan, Azerbaijan), with delays in development of new oil fields (Kazakhstan). As a result, growth in the CCA oil exporters is projected to decline by 2 pp to 3½ percent in 2015.
In the CCA oil importers, domestic demand is weakening with declining remittances, while lower prices for non-oil export commodities (gold, copper, and aluminum) are reducing export revenues.
The boost from lower global oil prices to growth is partially offset by currency weakening and incomplete pass-through to local fuel prices because of low competition (Armenia, Kyrgyz Republic) and long-term contracts that keep energy import prices rigid. Overall, growth in this group of countries is projected to slow by 3 pp to 1½ percent in 2015.
Rising Inflationary Pressures
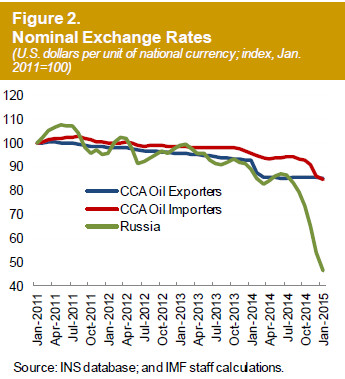
Inflationary pressures are rising on the back of currency depreciation across the region. Despite slight declines in 2014, owing to lower global food and commodity prices, weakening economic activity, and monetary tightening in some countries (Armenia, Kazakhstan, Georgia, Tajikistan), inflation is expected to rise by 1 pp to 7 percent this year. Declining exports and remittances as well as ruble depreciation have put pressure on the CCA currencies (Figure 2), resulting in Turkmenistan and Azerbaijan devaluing their currencies in early 2015. Meanwhile, Armenia, Georgia, Tajikistan, and the Kyrgyz Republic have allowed depreciation against the U.S. dollar to a varying degree to protect international reserves and support the domestic currency value of remittances.
As a result of the strong pass-through, coupled with credit growth (Kyrgyz Republic), inflation will reach double digits in the Kyrgyz Republic and Tajikistan. In other countries, inflation will remain contained, as increases in import and food prices will be offset by lower wage and input cost pressures, reflecting subdued domestic demand and lower oil prices.
Deteriorating External Positions
External positions in the CCA region are expected to weaken sharply in 2015, mainly as a result of lower oil prices and remittances. The current account balance in the CCA oil exporters is expected to turn from a surplus of 3 percent of GDP in 2014 to a deficit of 2½ percent in 2015, reflecting large oil export revenue losses and, in some cases, stronger import growth effected by fiscal easing (Figures 3–4).

The current account deficit in the CCA oil importers is expected to worsen slightly to 11 percent in 2015. A large drop in remittances is expected to offset gains from lower oil prices and moderating import growth.
Risks Are to the Downside
The balance of risks remains tilted to the downside. Key risks relate to a larger-than-expected slowdown in trading partners, particularly Russia, China, or the euro area, lower oil prices, and/or a faster-than-expected tightening of global financial conditions. For example, a deeper contraction in Russia would further slow remittances, exports, and direct investment. A continued depreciation of the ruble would further depress the value of remittances from Russia (Armenia, Kyrgyz Republic, Tajikistan). A further decline in oil prices would weaken the external and fiscal balances of the CCA oil exporters, while any additional benefit for the CCA oil importers is likely to be partly offset by adverse spillovers from a resulting further slowdown in Russia. An increase in external financing costs from a tightening of U.S. monetary policy would adversely affect countries that may borrow in the international markets (Georgia, Kazakhstan).
Temporary Fiscal Easing, Consolidation in Medium Term
While the drop in oil prices is expected to endure for sometime, Russia’s recession is likely to be temporary. Some CCA oil exporters (Kazakhstan, Uzbekistan) are expected to use their large buffers to provide countercyclical stimulus to the economy over the near term (in Kazakhstan, through increases in infrastructure spending). By contrast, Azerbaijan and Turkmenistan plan to undertake sizable consolidations in 2015 and over the medium term; with investment levels already high and reaching capacity constraints, fiscal stimulus through capital spending is not advisable. The countercyclical fiscal stance (especially in Kazakhstan), together with lower oil prices, is contributing to a turn in the oil exporters’ fiscal balance from a surplus of about 1½ percent in 2014 to a deficit close to 3 percent in 2015 (Figure 4).

Fiscal breakeven prices have risen in CCA oil exporters in recent years, and countries such as Azerbaijan and Kazakhstan cannot cover government spending at oil prices below $58, as is currently projected for 2015 (Figure 5)1. As soon as cyclical conditions allow and before buffers are exhausted, all CCA exporters need to return to the path of fiscal consolidation to rebuild buffers, strengthen fiscal sustainability, and ensure a fair sharing of resource revenues with future generations. Pension reforms (Azerbaijan) and the scaling down of energy subsidies (Turkmenistan, Uzbekistan) should continue, along with steps to improve the quality and efficiency of public spending.
The fiscal deficit in the CCA oil importers is projected to rise from about 2¼ percent in 2014 to about 4½ percent in 2015, mainly because of lower revenue collection due to weaker growth, and because of higher capital spending (a significant amount financed by China) in an effort to shore up domestic demand (Armenia, Kyrgyz Republic).

Given limited fiscal space, the oil importers need to return to consolidation soon. Prioritizing capital spending, streamlining current expenditures, eliminating tax exemptions, and improving revenue administration would rebuild buffers and create space to raise targeted social transfers and productive infrastructure investment, which would boost potential growth and make it more inclusive.
Greater Exchange Rate Flexibility, Monetary Tightening, Addressing Dollarization
The external pressures from the twin shocks of lower oil prices and Russia’s slowdown, as well as ruble depreciation and dollar appreciation, suggest that greater exchange rate flexibility will be needed for some countries to absorb the shocks, retain competitiveness in the face of upward pressure on the real exchange rate, and prevent a drain on reserves.
In countries where inflation is expected to be elevated, central banks should tighten monetary policy by raising the policy rate and improving liquidity management so as to contain excess liquidity, while using macroprudential instruments to discourage excessive credit growth.
In the medium term, efforts should focus on making monetary policy more effective in the context of high dollarization. A gradual move toward more flexible exchange rates, together with credible monetary and exchange rate frameworks, and deeper domestic financial markets would not only make monetary policy more effective but would also help to reduce dollarization.
Financial Sector Facing Increasing Challenges
The current economic environment is testing for banks, as financial systems are facing pressures from multiple sources. Currency depreciations, against the backdrop of dollarized banking systems and foreign currency lending to unhedged borrowers, increase credit and solvency risks. The depreciations also increase currency mismatches and exacerbate the already high dollarization by encouraging substitution into dollars on the deposit side and curtailing demand for foreign currency loans.
Slowing economic growth heightens the credit risks, particularly in countries where bank governance and underwriting standards are weak and directed lending is common. Declining remittances may erode banking system liquidity and the debt-servicing capacity of households, which account for a significant share of banks’ loan portfolios. With Russian banks facing a credit crunch, cross-country banking linkages with Russia could be a conduit for further liquidity pressures in some countries.
Supervisors will need to intensify surveillance of the financial systems, especially in countries where nonperforming loans are high (25 percent in Kazakhstan and 27 percent in Tajikistan) or rising (for example, Armenia) and capital adequacy ratios are declining. Forbearance and evergreening of loans should be avoided; instead, banks should be required to appropriately classify the loans and have adequate provisions. Liquidity support by central banks should be limited to solvent banks that face temporary liquidity challenges, and shareholders should be required to provide capital to undercapitalized banks. In addition, crisis management frameworks should be strengthened.
Bold Structural Reforms Are Needed
Some CCA countries have already undertaken market-enabling reforms such as privatization and price liberalization, but progress in market deepening, governance, and closing infrastructure gaps has been slow. Intensified efforts in these areas would create jobs, alleviate poverty, and diversify economies away from reliance on commodity exports and remittances.
Further reforms of business regulations are urgently needed. For example, the requirements for starting a business need to be based on simple and transparent rules. A new law on the fiscal regime for mining activities would enhance transparency in this sector in the Kyrgyz Republic. Trade integration, labor market reforms, and increasing competition in domestic industries (for example, in the energy sector in Armenia) would benefit the region.
Notes
1 The fiscal breakeven oil price is the average oil price that is needed for an oil-exporting country to balance its budget in a given year.
| Average | Projections | ||||||
| 2000–10 | 2011 | 2012 | 2013 | 2014 | 2015 | 2016 | |
| CCA | |||||||
Real GDP (annual growth) |
9.2 | 6.7 | 5.6 | 6.6 | 5.3 | 3.2 | 4.2 |
|
Current Account Balance |
0.8 | 7.3 | 3.1 | 1.5 | 1.7 | -3.4 | -2.0 |
|
Overall Fiscal Balance |
2.2 | 6.7 | 4.7 | 2.8 | 1.1 | -3.0 | -1.0 |
|
Inflation, p.a. (annual growth) |
9.8 | 9.0 | 5.3 | 6.0 | 5.8 | 7.0 | 6.6 |
| CCA oil and gas exporters | |||||||
|
Real GDP (annual growth) |
9.5 | 6.7 | 5.6 | 6.8 | 5.4 | 3.4 | 4.4 |
|
Current Account Balance |
2.1 | 9.3 | 4.6 | 2.4 | 3.0 | -2.6 | -1.2 |
|
Overall Fiscal Balance |
2.9 | 7.9 | 5.5 | 3.4 | 1.5 | -2.8 | -0.7 |
|
Inflation, p.a. (annual growth) |
10.0 | 8.8 | 5.7 | 6.3 | 5.9 | 6.9 | 6.7 |
| CCA oil and gas importers | |||||||
|
Real GDP (annual growth) |
6.6 | 6.4 | 5.5 | 5.7 | 4.6 | 1.5 | 2.6 |
|
Current Account Balance |
-8.2 | -10.4 | -10.4 | -7.3 | -10.1 | -10.9 | -10.5 |
|
Overall Fiscal Balance |
-3.2 | -3.2 | -2.2 | -2.5 | -2.2 | -4.4 | -3.8 |
|
Inflation, p.a. (annual growth) |
8.0 | 10.7 | 2.1 | 3.6 | 4.6 | 7.5 | 5.8 |
Sources: National authorities; and IMF staff calculations and projections. | |||||||
| As of March 23, 2015 | Average | ||||||
| 2000–10 | 2011 | 2012 | 2013 | 2014 | 2015 | 2016 | |
Real GDP Growth |
9.2 | 6.7 | 5.6 | 6.6 | 5.3 | 3.2 | 4.2 |
(Annual change; percent) | |||||||
Armenia |
8.2 | 4.7 | 7.1 | 3.5 | 3.4 | -1.0 | 0.0 |
Azerbaijan |
13.9 | 0.1 | 2.2 | 5.8 | 2.8 | 0.6 | 2.5 |
Georgia |
6.0 | 7.2 | 6.4 | 3.3 | 4.7 | 2.0 | 3.0 |
Kazakhstan |
8.5 | 7.5 | 5.0 | 6.0 | 4.3 | 2.0 | 3.1 |
Kyrgyz Republic |
4.2 | 6.0 | -0.9 | 10.5 | 3.6 | 1.7 | 3.4 |
Tajikistan |
8.0 | 7.4 | 7.5 | 7.4 | 6.7 | 3.0 | 4.1 |
Turkmenistan |
13.8 | 14.7 | 11.1 | 10.2 | 10.3 | 9.0 | 9.2 |
Uzbekistan |
6.7 | 8.3 | 8.2 | 8.0 | 8.1 | 6.2 | 6.5 |
Consumer Price Inflation |
9.8 | 9.0 | 5.3 | 6.0 | 5.8 | 7.0 | 6.6 |
(Year average; percent) | |||||||
Armenia |
3.9 | 7.7 | 2.5 | 5.8 | 3.1 | 6.4 | 4.0 |
|
Azerbaijan |
7.1 | 7.9 | 1.0 | 2.4 | 1.4 | 7.9 | 6.2 |
Georgia |
6.4 | 8.5 | -0.9 | -0.5 | 3.1 | 3.0 | 5.0 |
|
Kazakhstan |
9.0 | 8.3 | 5.1 | 5.8 | 6.7 | 5.2 | 5.5 |
Kyrgyz Republic |
8.6 | 16.6 | 2.8 | 6.6 | 7.5 | 10.7 | 8.6 |
Tajikistan |
15.5 | 12.4 | 5.8 | 5.0 | 6.1 | 12.8 | 6.3 |
Turkmenistan |
7.4 | 5.3 | 5.3 | 6.8 | 6.0 | 7.7 | 6.6 |
|
Uzbekistan |
15.5 | 12.8 | 12.1 | 11.2 | 8.4 | 9.5 | 9.8 |
|
General Gov. Overall Fiscal Balance |
2.2 | 6.7 | 4.7 | 2.8 | 1.1 | -3.0 | -1.0 |
Armenia1 |
-3.5 | -2.9 | -1.6 | -1.7 | -2.1 | -4.5 | -2.8 |
|
Azerbaijan1 |
4.2 | 13.6 | 4.9 | 0.8 | 0.5 | -5.8 | 1.5 |
|
Georgia |
-3.2 | -3.6 | -3.0 | -2.6 | -2.9 | -4.2 | -3.9 |
|
Kazakhstan |
2.5 | 5.9 | 4.5 | 5.0 | 1.9 | -3.3 | -2.0 |
|
Kyrgyz Republic |
-3.0 | -4.1 | -4.7 | -5.1 | -3.7 | -7.8 | -6.7 |
|
Tajikistan |
-3.2 | -2.1 | 0.6 | -0.8 | 0.1 | -1.8 | -2.2 |
|
Turkmenistan2 |
3.1 | 3.6 | 6.3 | 1.3 | 0.8 | -0.6 | 0.2 |
|
Uzbekistan |
2.3 | 8.8 | 8.5 | 2.9 | 1.7 | 0.0 | -0.1 |
Current Account Balance |
0.8 | 7.3 | 3.1 | 1.5 | 1.7 | -3.4 | -2.0 |
(Percent of GDP) | |||||||
Armenia |
-9.3 | -11.1 | -11.1 | -8.0 | -9.2 | -8.6 | -8.6 |
|
Azerbaijan |
5.3 | 26.5 | 21.8 | 17.0 | 15.3 | 5.3 | 8.2 |
Georgia |
-11.5 | -12.8 | -11.7 | -5.7 | -9.6 | -11.5 | -12.0 |
Kazakhstan |
-1.5 | 5.4 | 0.5 | 0.5 | 1.6 | -4.1 | -3.1 |
Kyrgyz Republic |
-3.0 | -9.6 | -15.6 | -15.0 | -13.7 | -17.0 | -15.2 |
Tajikistan |
-3.8 | -4.8 | -2.5 | -2.9 | -9.1 | -7.1 | -5.8 |
Turkmenistan |
4.3 | 2.0 | 0.0 | -7.3 | -5.9 | -11.1 | -6.7 |
|
Uzbekistan |
5.1 | 5.8 | 1.2 | -1.7 | 0.1 | 0.2 | 0.2 |
Sources: National authorities; and IMF staff estimates and projections. | |||||||
The IMF’s Middle East and Central Asia Department (MCD) countries and territories comprise Afghanistan, Algeria, Armenia, Azerbaijan, Bahrain, Djibouti, Egypt, Georgia, Iran, Iraq, Jordan, Kazakhstan, Kuwait, the Kyrgyz Republic, Lebanon, Libya, Mauritania, Morocco, Oman, Pakistan, Qatar, Saudi Arabia, Somalia, Sudan, Syria, Tajikistan, Tunisia, Turkmenistan, the United Arab Emirates, Uzbekistan, the West Bank and Gaza, and Yemen.
The following statistical appendix tables contain data for 31 MCD countries. Data revisions reflect changes in methodology and/or revisions provided by country authorities.
A number of assumptions have been adopted for the projections presented in the Regional Economic Outlook Update: Middle East and Central Asia. It has been assumed that established policies of national authorities will be maintained; that the price of oil 1 will average US$58.1 a barrel in 2015 and US$65.7 a barrel in 2016; and that the six-month London interbank offered rate (LIBOR) on U.S. dollar deposits will average 0.7 percent in 2015 and 1.9 percent in 2016. These are, of course, working hypotheses rather than forecasts, and the uncertainties surrounding them add to the margin of error that would in any event be involved in the projections. The 2015 and 2016 data in the figures and tables are projections. These projections are based on statistical information available through mid-March 2015.
Somalia is excluded from all regional aggregates due to a lack of reliable data.
2011 data for Sudan exclude South Sudan after July 9; data for 2012 onward pertain to the current Sudan.
All data for Syria are excluded for 2011 onward due to the uncertain political situation.
All data refer to the calendar years, except for the following countries, which refer to the fiscal years: Afghanistan (March 21/March 20 until 2011, and December 21/December 20 thereafter), Iran (March 21/March 20), Qatar (April/March), and Egypt and Pakistan (July/June) except inflation.
Data in Tables 7 and 8 relate to the calendar year for all aggregates and countries, except for Iran, for which the Iranian calendar year (beginning on March 21) is used.
Data for West Bank and Gaza are included in all tables except in 3–6, 8, 10, 13, and 14.
In Tables 3, 6, 13, and 14, “oil” includes gas, which is also an important resource in several countries.
REO aggregates are constructed using a variety of weights as appropriate to the series:
Composites for data relating to the domestic economy (Tables 1, 3, 7–8, and 10–17), whether growth rates or ratios, are weighted by GDP valued at purchasing power parities (PPPs) as a share of total MCD or group GDP. Country group composites for the growth rates of broad money (Table 9) are weighted by GDP converted to U.S. dollars at market exchange rates (both GDP and exchange rates are averaged over the preceding three years) as a share of MCD
or group GDP.
Composites relating to the external economy in nominal terms (Tables 18–20 and 22) are sums of individual country data. Composites relating to external economy in percent of GDP (Tables 21 and 23) are weighted by GDP in U.S.
dollars as a share of MCD or group GDP in U.S. dollars.
Composites in Tables 2, 4, and 5 are sums of the individual country data.
The following conventions are used in this publication:
In tables, ellipsis points (. . .) indicate “not available,” and 0 or 0.0 indicates “zero” or “negligible.” Minor discrepancies between sums of constituent figures and totals are due to rounding.
1/ Simple average prices of U.K Brent, Dubai, and West Texas Intermediate crude oil.


