

Kingdom of the Netherlands—Curaçao and Sint Maarten: Concluding Statement of the 2016 Article IV Consultation Discussions Visit
May 25, 2016
A Concluding Statement describes the preliminary findings of IMF staff at the end of an official staff visit (or ‘mission’), in most cases to a member country. Visits are undertaken as part of regular consultations under Article IV of the IMF's Articles of Agreement, in the context of a request to use IMF resources (borrow from the IMF), as part of discussions of staff monitored programs, or as part of other staff monitoring of economic developments.
The authorities have consented to the publication of this statement. The views expressed in this statement are those of the IMF staff and do not necessarily represent the views of the IMF’s Executive Board. Based on the preliminary findings of this mission, staff will prepare a report that, subject to management approval, will be presented to the IMF Executive Board for discussion and decision.
1. The currency union of Curaçao and Sint Maarten has important strengths, but preserving these going forward will require surmounting some critical challenges. GDP per capita is already at high-income country levels, but the islands must combat lackluster growth and high unemployment levels by addressing weak competitiveness and improving the investment environment. The fiscal situation remains relatively favorable, following the debt relief in 2010, but sustained efforts on fiscal and structural reforms are required to lock in gains and ensure continued fiscal and debt sustainability. The authorities’ structural reform plans are welcome, but continuity in policy will be essential going forward, particularly in the context of the upcoming elections in both countries, scheduled for September.
Current situation
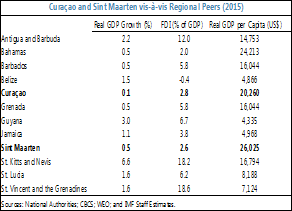
2. For several years now, both islands have experienced lackluster growth, trailing behind regional peers. Curaçao’s economy grew by 0.1 percent in 2015, while Sint Maarten expanded by 0.5 percent. Investment supported growth in Curaçao last year, but consumption and net external demand contracted, while GDP expansion in Sint Maarten reflected an increase in stay-over tourist arrivals. Growth is expected to moderately improve in 2016, with real GDP growth projected at 0.5 percent in Curaçao and 0.7 percent in Sint Maarten. Notwithstanding the considerable negative impact from deteriorating economic conditions in Venezuela on tourism and trade balances in Curaçao, the external position of the currency union has slightly improved as the current account deficit narrowed from 11.5 percent of GDP in 2014 to 10.9 percent of GDP in 2015, due to higher tourist arrivals and lower international oil prices. Inflation remains low, largely due to lower energy prices, and unemployment continues to be at high levels, especially among the youth.
3. While both islands complied with their fiscal rules in 2015, fiscal performance diverged. In Curaçao, despite higher revenues, the primary deficit increased to 1.7 percent of GDP in 2015 from 0.7 percent in 2014, reflecting higher capital spending and transfers to the social security fund and the hospital to cover operational deficits. In Sint Maarten, the primary deficit improved to 0.6 percent of GDP in 2015, from 3.9 percent in 2014, reflecting lower wage expenditure and capital spending, and higher tax revenues. Public debt remains low in both islands (44⅓ percent of GDP in Curaçao and 36½ percent of GDP in Sint Maarten in 2015) but has increased steadily since the debt relief in 2010.
Outlook and Risks
4. Looking forward, medium-term projections envisage modest growth in both islands. Curaçao and Sint Maarten’s medium term growth rates are projected at 0.9 and 1.3 percent respectively. The current account deficit is expected to continue narrowing gradually over the medium-term, financed largely by FDI and portfolio investment. The fiscal position in Curaçao is projected to improve in the near-term due to lower public infrastructure spending; however, on current policies public debt will continue on an upward trajectory. Sint Maarten’s fiscal balance is expected to improve based on stronger tax collection (including on casino tax) and higher dividends from the central bank.
5. Risks to the macroeconomic outlook are tilted to the downside. Low foreign direct investment (FDI) is expected to continue to hamper growth but there is an upside risk if planned large infrastructure and FDI projects materialize. Other upside risks include possible productivity gains from higher investment in human capital and stronger growth in the U.S. Downside risks mainly stem from slower euro area recovery.
6. Important downside risk could arise from persistent disruption of economic activity in Venezuela, Curaçao’s main trading partner, through the refinery, the offshore financial sector, and trade (including through the free-zone) and tourism flows. While in the near-term, adequate reserves (currently covering more than six months of imports) should cushion the impact of reduced trade and tourism flows from Venezuela, over the medium-term stronger export performance will be required to boost reserves and maintain external sustainability. Decisive implementation of the recommended structural reforms to strengthen competitiveness (highlighted below) would be needed to support growth and mitigate any negative impact from continued deterioration in economic conditions in Venezuela.
Policies: growth and competitiveness
7. The mission welcomes the authorities’ ambitious plans to strengthen competiveness and reinvigorate the economies through important structural reforms. In Curaçao, the National Development Plan 2015-30 aims at encouraging foreign direct investment, stimulating priority sectors with potential for higher value added (including free zone, maritime and aviation), ensuring inclusive quality education, and promoting good governance. In Sint Maarten, where tourism represents a higher share of the economy, a tourism authority has been recently established and a development plan is currently being discussed, to diversify the tourism sector, reduce its seasonality, and increase value-added.
8. Given the Union’s small population base, a flexible labor market equipped with appropriate skills is needed to improve competitiveness and growth potential. In Curaçao, labor market reforms should focus on addressing restrictive dismissal laws and protective work permit policies (for foreign labor) that hinder labor market flexibility. Although the labor market in Sint Maarten is less restrictive, efforts are needed to improve efficiency and timeliness in granting required permits for foreign workers. To address mismatches in skills, the authorities in both islands have recognized the need to refocus the education system. The mission recommends that renewed efforts are also urgently needed to improve vocational education and develop targeted training programs to strengthen skills and improve productivity. The Sint Maarten authorities have recently embarked on a government-sponsored employment program to address the high youth unemployment. Close monitoring and assessment of skills development of program participants will be critical to ensure that public resources are effectively deployed.
9. Improving the business climate is critical to reigniting investor confidence, promoting private sector activity, and attracting foreign direct investment. The mission therefore welcomes the authorities’ efforts in both islands in rationalizing business licensing requirements, reducing transportation costs, and promoting fair competition. The mission also endorses the authorities’ plan to proactively address red tape through centralization and streamlining of the business registration process, and to improve efficiency in government services and reduce transaction costs to foster a competitive investment environment. In addition, maintaining a stable political environment and ensuing policy continuity is critical to promoting business long term investment decisions.
Policies: fiscal
10. The current rules-based fiscal framework could be strengthened, while allowing flexibility to address key structural issues, to ensure fiscal and debt sustainability. The framework is geared toward containing short-term fiscal risks, but it does not provide a strong anchor for debt sustainability over the medium term or any flexibility to accommodate the investment in human resources that is crucial to unlocking growth. Hence, the mission proposes that the rules be supported by adopting a medium-term macro-fiscal framework with a long-run debt anchor of 40 percent of GDP, which is around the median level of developing and emerging countries. The fiscal framework should be complemented by improved effectiveness of public spending and capacity building to strengthen public institutions and fiscal discipline. A strengthened fiscal framework is particularly important in the context of the upcoming 2018 review of the Board of Financial Supervision (CFT in Dutch) oversight function and the current low-cost “standing subscription” borrowing arrangement.
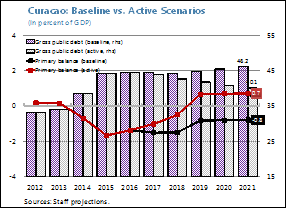
11. In Curaçao, to mitigate medium-term risks, the mission discussed a fiscal framework that envisages a 1.5 percent of GDP adjustment phased evenly over 2017-19. This framework is anchored by a 40 percent of GDP long term debt target, with allowance for temporary deviation over economic cycles, and is operated via targets on the primary balance (fiscal balance excluding interest). The adjustments in the primary balance needed for debt to stabilize at 40 percent could be achieved by: (i) improving tax compliance (0.5 percent of GDP), (ii) reducing personnel expenditure through attrition and implementation of merit-based salary increments (0.4 percent of GDP), and (iii) containing national health insurance expenses through cost restructuring (0.6 percent of GDP). In this respect, the authorities have made significant efforts to strengthen tax administration. The mission also welcomes the important progress made in improving the financial performance of state-owned enterprises and encourages the authorities to finalize the action plan for the financially-challenged postal corporation. Despite recent reforms, the old age pension fund (AOV) remains in deficit and heavily reliant on budgetary transfers, which could pose a risk to medium-term fiscal sustainability.
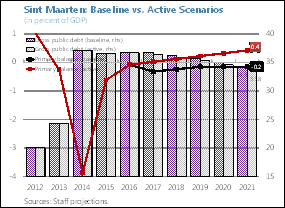
12. In Sint Maarten, policy should focus on preserving fiscal and debt sustainability, building fiscal buffers for natural disasters, and strengthening institutional capacity to support prudent fiscal management. The mission welcomes the authorities’ efforts to improve public financial management (PFM) and achieve compliance with fiscal rules. However, further efforts to improve PFM in critical areas, including in budget formulation and cash flow management, are vital to underpin the fiscal framework. In addition, there is an urgent need to develop capacity in tax administration and to support the production of timely economic statistics, essential to public policy formulation. Over the medium term, policy should focus on tax reforms to widen the revenue base, continued efforts to contain expenditures, and a proactive approach to address the public sector pension shortfall. The mission welcomes the authorities’ plans to set aside budget resources annually as precautionary savings for natural disasters, and encourages the authorities to establish a dedicated account for this purpose to support immediate rehabilitation needs. The mission proposes that the authorities target saving a minimum of 0.1 percent of GDP per annum based on estimated damages from previous natural disaster events in the region.
Policies: financial sector
13. Despite recent deterioration in banking sector asset quality and profitability, the financial sector appears to be generally stable, supported by an adequate capital buffer. Nonetheless, credit growth remains weak, despite ample liquidity, reflecting banks’ lower risk appetite and subdued credit demand given uncertainties in the macroeconomic outlook. The mission welcomes the authorities’ continued efforts to strengthen the AML/CFT framework in both islands, which would also help mitigate the “de-risking” (financial institutions terminating or restricting business relationships with clients or categories of clients to minimize risk) risks, as some small local banks have recently experienced loss of correspondent banking relationships. The mission encourages the authorities to continue their efforts to strengthen financial supervision, especially in the non-bank sector, at both system and institution levels.
*****
The mission would like to thank the authorities in Curaçao and Sint Maarten for an open and constructive dialogue. The mission is grateful to colleagues at the Central Bank of Curaçao and Sint Maarten, Council of Ministers, Ministry of Finance, Ministry of Economic Affairs, the CFT, and other senior government officials for the open and constructive meetings, and assistance to the mission’s work. It would also like to thank representatives of the banking, business, labor, and tourism sectors for their excellent collaboration, which aided staff in their understanding of economic developments in both islands of the currency union.
| Table 1. Curacao: Selected Economic and Financial Indicators - Baseline Scenario, 2011–21 | ||||||||||||||||||||||
|
|
|
| ||||||||||||||||||||
|
Area |
|
|
444 (km2) |
Population, thousand (2015) |
155 |
|
|
|
|
|||||||||||||
|
Percent of population below age 15 (2015) |
|
18.9 |
Literacy rate, in percent (2010) |
96.7 |
|
|
|
|
||||||||||||||
|
Percent of population aged 65+ (2015) |
|
15.3 |
Life expectancy at birth, male (2015) |
74.8 |
|
|
|
|
||||||||||||||
|
Infant mortality, over 1,000 live births (2015) |
|
12.2 |
Life expectancy at birth, female (2015) |
81.0 |
|
|
|
|
||||||||||||||
|
|
|
|
|
|
|
|
|
|
|
|
|
|||||||||||
|
|
|
|
2011 | 2012 | 2013 | 2014 | 2015 | 2016 | 2017 | 2018 | 2019 | 2020 | 2021 | |||||||||
|
|
|
|
|
|
|
|
|
Proj. | ||||||||||||||
|
|
|
|
|
|
|
|
|
|
|
|
|
|
| |||||||||
|
Real economy (change in percent) |
|
|
|
|
|
|
|
|||||||||||||||
|
Real GDP 1/ |
|
|
0.6 | -0.1 | -0.8 | -1.1 | 0.1 | 0.5 | 0.7 | 0.7 | 0.7 | 0.8 | 0.9 | |||||||||
|
CPI (12-month average) |
|
2.3 | 3.2 | 1.3 | 1.5 | -0.5 | 0.8 | 1.5 | 2.3 | 2.4 | 2.3 | 2.1 | ||||||||||
|
Unemployment rate (in percent) |
|
9.8 | 11.5 | 13.0 | 12.6 | 11.7 | 11.4 | 11.1 | 11.3 | 11.6 | 11.8 | 12.0 | ||||||||||
|
|
|
|
|
|
|
|
|
|
|
|
|
|
| |||||||||
|
General government finances (in percent of GDP) |
|
|
|
|
|
|
|
|
|
|
| |||||||||||
|
Primary balance |
|
|
-1.4 | 0.2 | 0.2 | -0.7 | -1.7 | -1.4 | -1.5 | -1.5 | -0.8 | -0.8 | -0.8 | |||||||||
|
Current balance 2/ |
|
-2.0 | 0.2 | 2.3 | 0.6 | 1.1 | 1.0 | 0.8 | 0.7 | 0.8 | 0.7 | 0.6 | ||||||||||
|
Overall balance |
|
|
-2.3 | -0.7 | -0.7 | -1.8 | -2.8 | -2.5 | -2.7 | -2.7 | -2.0 | -2.0 | -2.1 | |||||||||
|
Public debt |
|
|
40.6 | 33.1 | 34.1 | 38.6 | 44.3 | 44.5 | 44.5 | 44.2 | 44.8 | 45.5 | 46.2 | |||||||||
|
|
|
|
|
|
|
|
|
|
|
|
|
|
| |||||||||
|
Balance of payments (in percent of GDP) |
|
|
|
|
|
|
|
|
|
|
|
| ||||||||||
|
Goods trade balance |
|
-39.5 | -41.7 | -38.3 | -35.4 | -32.9 | -32.1 | -31.6 | -30.9 | -30.4 | -29.7 | -29.0 | ||||||||||
|
Exports of goods |
|
30.6 | 30.3 | 22.3 | 22.1 | 15.2 | 14.6 | 14.7 | 14.8 | 14.8 | 14.9 | 15.1 | ||||||||||
|
Imports of goods |
|
70.1 | 72.0 | 60.5 | 57.6 | 48.1 | 46.6 | 46.3 | 45.7 | 45.2 | 44.6 | 44.0 | ||||||||||
|
Service balance |
|
|
14.3 | 17.4 | 21.7 | 26.5 | 19.1 | 18.2 | 18.9 | 19.4 | 19.7 | 20.5 | 21.2 | |||||||||
|
Exports of services |
|
40.4 | 45.4 | 49.9 | 54.2 | 47.8 | 46.0 | 46.5 | 46.6 | 46.6 | 47.0 | 47.5 | ||||||||||
|
Imports of services |
|
26.2 | 27.9 | 28.2 | 27.7 | 28.6 | 27.8 | 27.6 | 27.2 | 26.9 | 26.6 | 26.2 | ||||||||||
|
Current account |
|
|
-27.3 | -27.9 | -21.0 | -11.9 | -15.3 | -15.2 | -13.8 | -12.6 | -11.6 | -10.2 | -8.7 | |||||||||
|
Capital and financial account |
|
26.9 | 23.6 | 20.2 | 16.8 | 14.5 | 15.8 | 14.1 | 12.8 | 12.0 | 10.6 | 9.0 | ||||||||||
|
Net FDI |
|
|
3.3 | 1.9 | 1.1 | 0.8 | 2.8 | 3.5 | 3.6 | 3.5 | 3.4 | 2.9 | 2.9 | |||||||||
|
Net official reserves (in millions of US dollars) |
|
1,244.1 | 1,246.3 | 1,096.4 | 1,337.0 | 1,344.9 | 1,366.0 | 1,378.5 | 1,386.6 | 1,402.2 | 1,419.7 | 1,430.3 | ||||||||||
|
(in months of imports of goods and services) |
5.1 | 4.8 | 4.7 | 6.0 | 6.7 | 6.9 | 6.9 | 6.8 | 6.7 | 6.7 | 6.6 | |||||||||||
|
(In percent of short-term debt) |
|
118.1 | 146.9 | 109.3 | 125.0 | 125.9 | 128.9 | 121.3 | 114.6 | 109.7 | 106.1 | 103.0 | ||||||||||
|
External debt (in percent of GDP) |
|
89.1 | 81.3 | 86.9 | 93.7 | 103.4 | 110.9 | 116.4 | 120.2 | 123.1 | 125.1 | 126.0 | ||||||||||
|
|
|
|
|
|
|
|
|
|
|
|
|
|
| |||||||||
|
Memorandum items: |
|
|
|
|
|
|
|
|
|
|
|
| ||||||||||
|
Nominal GDP (in millions of US dollars) |
|
3,039 | 3,133 | 3,148 | 3,160 | 3,146 | 3,186 | 3,256 | 3,354 | 3,460 | 3,567 | 3,674 | ||||||||||
|
Per capita GDP (in US dollars) |
|
20,551 | 20,979 | 20,879 | 20,622 | 20,260 | 20,154 | 20,396 | 20,803 | 21,247 | 21,687 | 22,118 | ||||||||||
|
Per capita GDP (change in percent) |
|
2.5 | 2.1 | -0.5 | -1.2 | -1.8 | -0.5 | 1.2 | 2.0 | 2.1 | 2.1 | 2.0 | ||||||||||
|
Private sector credit (change in percent) |
|
3.3 | 6.4 | 1.1 | -1.5 | -1.0 | … | … | … | … | … | … | ||||||||||
|
|
|
|
|
|
|
|
|
|
|
|
|
|||||||||||
|
Fund position |
|
|
Curacao is part of the Kingdom of the Netherlands and does not have a separate quota. |
|
|
|
||||||||||||||||
|
|
|
|
|
|
|
|
||||||||||||||||
|
|
|
|
|
|
|
|
|
|
|
|
|
|||||||||||
|
Exchange rate |
|
|
|
The Netherlands' Antilles guilder is pegged to the U.S. dollar at NA.f 1.79 = US$1. |
|
|
|
|||||||||||||||
|
|
|
|
|
|
|
|
||||||||||||||||
|
|
|
|
|
|
|
|
|
|
|
|
|
|
| |||||||||
|
|
|
|
|
|
|
|
|
|
|
|
|
|||||||||||
|
Sources: Data provided by the authorities; and IMF staff estimates. |
|
|
|
|
|
|
|
|
|
|||||||||||||
|
1/ Based on IMF staff estimates of deflators. |
|
|
|
|
|
|
|
|
||||||||||||||
|
2/ Excludes consumption of fixed capital. |
|
|
|
|
|
|
|
|
||||||||||||||
| Table 2. St. Maarten: Selected Economic and Financial Indicators - Baseline Scenario, 2011–21 | ||||||||||||||||||||||
|
|
|
| ||||||||||||||||||||
|
Area |
|
|
34 (km2) |
Population (2015) |
38 |
|
|
|
|
|
| |||||||||||
|
Percent of population below age 15 (2015) |
|
21.2 |
Literacy rate, in percent (2011) |
93.8 |
|
|
|
|
|
| ||||||||||||
|
Percent of population aged 65+ (2015) |
|
6.4 |
Life expectancy at birth, male (2012) |
69.2 |
|
|
|
|
|
| ||||||||||||
|
Infant mortality, over 1,000 live births (2010) |
|
6.0 |
Life expectancy at birth, female (2012) |
77.1 |
|
|
|
|
|
| ||||||||||||
|
|
|
|
|
|
|
|
|
|
|
|
|
|
| |||||||||
|
|
|
|
|
|
|
|
|
|
|
|||||||||||||
|
|
|
|
2011 | 2012 | 2013 | 2014 | 2015 | 2016 | 2017 | 2018 | 2019 | 2020 | 2021 | |||||||||
|
|
|
|
|
|
|
|
|
Proj. | ||||||||||||||
|
|
|
|
|
|
|
|
|
|
|
|
|
|||||||||||
|
Real economy (change in percent) |
|
|
|
|
|
|
|
|
|
|
||||||||||||
|
Real GDP 1/ |
|
|
-1.5 | 1.7 | 0.9 | 1.5 | 0.5 | 0.7 | 0.9 | 1.1 | 1.1 | 1.2 | 1.3 | |||||||||
|
CPI (12-month average) |
|
4.6 | 4.0 | 2.5 | 1.9 | 0.3 | 1.0 | 1.7 | 2.6 | 2.7 | 2.8 | 2.8 | ||||||||||
|
Unemployment rate (in percent) |
|
11.5 | 10.3 | 9.2 | 9.1 | 8.9 | 8.7 | 8.6 | 8.4 | 8.2 | 8.0 | 8.0 | ||||||||||
|
|
|
|
|
|
|
|
|
|
|
|
|
|
| |||||||||
|
General government finances (in percent of GDP) |
|
|
|
|
|
|
|
|
|
|
|
| ||||||||||
|
Primary balance |
|
|
1.3 | 1.0 | -0.3 | -3.9 | -0.6 | -0.1 | -0.3 | -0.2 | -0.2 | -0.2 | -0.2 | |||||||||
|
Current balance 2/ |
|
1.4 | 2.7 | 0.6 | 0.2 | 0.7 | 1.7 | 1.5 | 1.7 | 1.8 | 1.8 | 1.8 | ||||||||||
|
Overall balance |
|
|
0.7 | 0.4 | -0.8 | -4.5 | -1.3 | -0.8 | -1.0 | -0.8 | -0.7 | -0.7 | -0.7 | |||||||||
|
Public debt |
|
|
27.3 | 20.0 | 24.3 | 37.1 | 36.5 | 36.7 | 36.7 | 36.3 | 35.7 | 35.0 | 34.3 | |||||||||
|
|
|
|
|
|
|
|
|
|
|
|
|
|
| |||||||||
|
Balance of payments (in percent of GDP) |
|
|
|
|
|
|
|
|
|
|
|
| ||||||||||
|
Goods trade balance |
|
-59.7 | -64.8 | -74.8 | -83.8 | -71.8 | -72.5 | -72.4 | -71.5 | -70.4 | -70.7 | -70.9 | ||||||||||
|
Exports of goods |
|
12.5 | 13.3 | 16.2 | 12.6 | 12.2 | 12.1 | 12.1 | 12.5 | 13.0 | 13.5 | 14.0 | ||||||||||
|
Imports of goods |
|
72.2 | 78.1 | 91.0 | 96.4 | 84.0 | 84.6 | 84.5 | 84.0 | 83.3 | 84.2 | 84.9 | ||||||||||
|
Service balance |
|
|
65.4 | 79.0 | 78.8 | 78.8 | 80.3 | 79.8 | 78.9 | 77.6 | 76.7 | 77.1 | 77.2 | |||||||||
|
Exports of services |
|
88.9 | 106.0 | 104.8 | 106.6 | 106.7 | 106.0 | 104.8 | 103.1 | 101.8 | 101.9 | 101.8 | ||||||||||
|
Imports of services |
|
23.5 | 27.0 | 26.1 | 27.8 | 26.4 | 26.2 | 25.9 | 25.5 | 25.2 | 24.8 | 24.6 | ||||||||||
|
Current account |
|
|
-0.5 | 9.5 | 0.4 | -10.5 | 2.2 | 2.3 | 2.6 | 2.3 | 2.5 | 2.5 | 3.0 | |||||||||
|
Capital and financial account |
|
0.5 | -18.9 | -6.3 | 14.1 | -3.4 | -1.6 | -1.0 | -0.8 | -1.9 | -1.7 | -1.9 | ||||||||||
|
Net FDI |
|
|
-4.9 | 1.6 | 4.3 | 4.4 | 2.6 | 3.5 | 3.0 | 3.0 | 3.0 | 3.0 | 3.0 | |||||||||
|
Net official reserves (in millions of US dollars) |
|
249.1 | 249.5 | 219.5 | 267.7 | 269.3 | 279.2 | 302.1 | 323.7 | 332.1 | 344.9 | 362.3 | ||||||||||
|
(in months of imports of goods and services) |
|
3.1 | 2.9 | 2.2 | 2.5 | 2.8 | 2.8 | 3.0 | 3.1 | 3.1 | 3.1 | 3.1 | ||||||||||
|
(In percent of short-term debt) |
|
87.6 | 91.9 | 77.0 | 96.3 | 91.4 | 94.7 | 106.1 | 117.8 | 128.7 | 142.8 | 162.8 | ||||||||||
|
External debt (in percent of GDP) |
|
66.4 | 60.4 | 58.6 | 65.1 | 65.0 | 60.8 | 57.2 | 53.3 | 48.2 | 43.4 | 38.4 | ||||||||||
|
|
|
|
|
|
|
|
|
|
|
|
|
|
| |||||||||
|
Memorandum items: |
|
|
|
|
|
|
|
|
|
|
|
| ||||||||||
|
Nominal GDP (in millions of US dollars) |
|
938 | 976 | 1,015 | 983 | 1,016 | 1,051 | 1,059 | 1,077 | 1,106 | 1,146 | 1,190 | ||||||||||
|
Per capita GDP (in US dollars) |
|
26,386 | 25,157 | 25,294 | 25,967 | 26,025 | 26,290 | 26,807 | 27,640 | 28,533 | 29,516 | 30,559 | ||||||||||
|
Per capita GDP (change in percent) |
|
3.9 | 7.5 | 2.3 | -4.7 | 0.5 | 2.7 | 0.2 | 1.0 | 2.0 | 3.1 | 3.2 | ||||||||||
|
Private sector credit (change in percent) |
|
1.0 | -4.9 | -2.1 | -1.9 | 0.4 | … | … | … | … | … | … | ||||||||||
|
|
|
|
|
|
|
|
|
|
|
|
|
|||||||||||
|
Fund position |
|
|
|
Curacao is part of the Kingdom of the Netherlands and does not have a separate quota. |
|
|
|
|||||||||||||||
|
|
|
|
|
|
|
|
||||||||||||||||
|
|
|
|
|
|
|
|
||||||||||||||||
|
Exchange rate |
The Netherlands' Antilles guilder is pegged to the U.S. dollar at NA.f 1.79 = US$1. | |||||||||||||||||||||
|
Sources: Data provided by the authorities; and IMF staff estimates. |
|
|
|
|
|
|
|
|
|
|||||||||||||
|
1/ Based on IMF staff estimates of deflators. |
|
|
|
|
|
|
|
|
||||||||||||||
|
2/ Excludes consumption of fixed capital. |
|
|
|
|
|
|
|
|
||||||||||||||
|
|
||||||||||||||||||||||
|
|
|
|
|
|
|
|
|
| Curacao: Key Policy Recommendations (Preliminary) | Sint Maarten: Key Policy Recommendations (Preliminary) | ||||||
|
|
|
|
|
|
|
|
|
|
|
Competitiveness and Growth |
| |||||
|
|
|
Competitiveness: Steadfastly implement recommendations in National Development Plan to reduce red tape and improve bureaucratic efficiency. Over the medium term, advance policy actions to encourage FDI and diversify the economy. |
|
|
|
Competitiveness: Operationalize the newly established tourism authority, finalize and implement the tourism development sector plan aimed at diversifying the sector, reducing its seasonality, and increasing value-added. |
|
|
|
|
Labor market: Relax dismissal laws to allow labor market to be more conducive to cyclical shifts in labor demand and ease restrictions to hire foreign workers. Restructure public spending to prioritize improvements in technical and vocational training to address skills mismatches and meet the needs of the economy. |
|
|
|
Labor market: Improve efficiency and timeliness in granting required permits for foreign workers. Refocus education system and improve vocational training to address skills mismatch. Close monitoring and assessment of the proposed youth employment program to ensure skills development. |
|
|
|
|
Doing business: Rationalize business licensing requirements, centralize and streamline business registration process, improve efficiency in government services, and reduce transaction costs. Reduce transportation costs and promote fair competition. Ensure stable political environment and policy continuity. |
| ||||
|
|
|
|
|
|
|
|
|
|
|
Fiscal Sustainability |
| |||||
|
|
Fiscal policy framework: Support current fiscal rule with a medium-term macro-fiscal framework, with a long term debt anchor (40 percent of GDP) operated through a primary balance target. Complement the fiscal framework with improved effectiveness of public spending and capacity building to address identified weaknesses in public financing management (PFM) highlighted by the PEFA. |
| |||||
|
|
Tax policy: Improve tax compliance through continued efforts on strengthening tax administration. |
|
|
Fiscal contingencies: Build fiscal buffers for natural disasters through fiscal savings in a dedicated account to accommodate immediate rehabilitation needs in the event of natural disasters. Staff proposes 0.1 percent of GDP per year. |
| ||
|
|
|
Wages: Continue attrition policy and ensure implementation of merit-based salary increments. Modernize public sector over the medium-term. |
|
|
|
Tax policy: Improve tax compliance through continued efforts on strengthening tax administration. Follow through tax reforms over the medium-term to broaden revenue base. |
|
|
|
|
Social benefits: Contain national health insurance expenses through cost restructuring. Rationalize unemployment welfare and benefits to eliminate disincentives to work. |
|
|
|
Public finance management: Strengthen public finance management by adopting a PFM law and improving budget formulation and cash flow management. Seek technical assistance to support these efforts. |
|
|
|
|
State-owned enterprises: Finalize the action plan for improving financial performance of the postal corporation. |
|
|
|
Social benefits: Proactively address public worker pension shortfalls through parametric and structural reforms. |
|
|
|
|
|
|
|
|
|
|
|
|
|
|
|
|
|
|
|
|
|
Financial Stability |
| |||||
|
|
|
Financial supervision: Strengthen financial supervision, especially in the non-bank sector, at both system and institution levels. |
| ||||
|
|
|
AML/CFT: Continue efforts to strengthen the AML/CFT framework, which would also help mitigate the “de-risking” risks. |
| ||||
|
|
|
| |||||
|
|
Statistical Infrastructure |
| |||||
|
|
|
Data: Ensure timely production of economic statistics essential to public policy formulation. Seek technical assistance to support these efforts. |
| ||||
| |||||||||||||||||||||||||||||||||||||||||||||||||||||||||||||||||||||||||||||||||||||||||||||||||||||||||||||||||||||||||||||||||||||||||||||||||||||||||||||||||||||||||||||||||||||||||||||||||||||||||||||||||||||||||||||||||||||||||||||||||||||||||||||||||||||||||||||||||||||||||||||||||||||||||||||||||||||||||||||||||||||||||||||||||||||||||||||||||||||||||||||||||||||||||||||||||||||||||||||||||||||||||||||||||||||||||||||||||||||||||||||||||||||||||||||||||||||||||||||||||||||||||||||||||||||||||||||||||||||||||||||||||||||||||||||||||||||||||||||||||||||||||||||||||||||||||||||||||||||||||||||||||||||||||||||||||||||||||||||||||||||||||||||||||||||||||||||||||||||||||||||||||||||||||||||||||||||||||||||||||||||||||||||||||||||||||||||||||||||||||||||||||||||||||||||||||||||||||||||||||||||||||||||||||||||||||||||||||||||||||||||||||||||||||||||||||||||||||||||||||||||||||||||||||||||||||||||||||||||||||||||||||||||||||||||||||||||||||||||||||||||||||||||||||||||||||||||||||||||||
IMF COMMUNICATIONS DEPARTMENT
| Public Affairs | Media Relations | |||
|---|---|---|---|---|
| E-mail: | publicaffairs@imf.org | E-mail: | media@imf.org | |
| Fax: | 202-623-6220 | Phone: | 202-623-7100 | |