South Africa: Concluding Statement of an IMF Staff Visit
June 23, 2015
A Concluding Statement describes the preliminary findings of IMF staff at the end of an official staff visit (or ‘mission’), in most cases to a member country. Missions are undertaken as part of regular (usually annual) consultations under Article IV of the IMF's Articles of Agreement, in the context of a request to use IMF resources (borrow from the IMF), as part of discussions of staff monitored programs, or as part of other staff monitoring of economic developments.
The authorities have consented to the publication of this statement. The views expressed in this statement are those of the IMF staff and do not necessarily represent the views of the IMF’s Executive Board.
An International Monetary Fund (IMF) team visited South Africa June 1–9, 2015 to discuss the outlook, risks, and policy challenges facing the South African economy. The main themes, which are broadly similar to those of the 2014 Article IV Consultation, are:
- The growth and jobs outlook remains lackluster, with growth projected at 2 percent in 2015–16.
- The improvement in the terms of trade has temporarily lowered inflation and somewhat reduced external vulnerability.
- Downside risks persist, mainly stemming from electricity shortages, policy uncertainty, volatility in global financial markets, and global growth.
- Reducing electricity shortages is the utmost priority. Other long-standing structural reform recommendations remain essential to boost growth and jobs.
- The 2015 Budget rightly adjusts to lower potential growth. But there are fiscal risks, especially from state-owned enterprises (SOEs), that need attention.
- Monetary policy can remain accommodative unless the inflation outlook worsens or external financing conditions deteriorate.
- Building external buffers and strengthening the financial safety net remains important to increase resilience.
We thank the authorities for productive discussions and their warm hospitality.
The Outlook
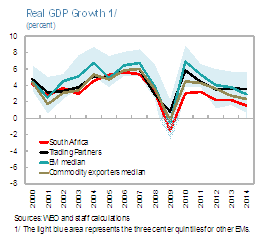
1. Lackluster growth and job prospects. Real GDP growth hit a post-crisis low of 1.5 percent in 2014, entailing no improvement in per capita income, due to protracted strikes and electricity constraints. South Africa continued to underperform peer Emerging Markets (EMs), and the gap with trading partners widened. As the electricity crisis has deepened, only a muted recovery to 2 percent growth is expected in 2015–16 mainly due to the anticipation of fewer days lost to strikes. Lower oil prices have improved the terms of trade, but are expected to have a negligible impact on growth as highly-leveraged consumers may not spend much of the extra income and electricity constraints hinder domestic production expansion. Headwinds to growth also stem from the needed fiscal consolidation, high policy uncertainty, and tighter financial conditions. The improvement in growth over the medium term to about 2.8 percent is predicated on increased energy availability. Unemployment is expected to remain above 25 percent, unless major policy changes are implemented.
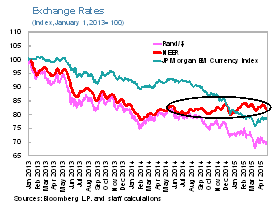
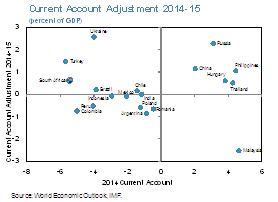
2. Somewhat improved external position and inflation. A positive terms of trade shock in 2015—lower oil prices more than offsetting softer export commodity prices—is anticipated to reduce the current account deficit to 4.8 percent of GDP. The projected improvement in the current account balance (of 0.6 percentage point of GDP) is expected to be greater than most emerging markets and persist in outer years reflecting some trade volume adjustment. A lower current account deficit, coupled with the relative resilience of South African balance sheets to dollar appreciation, has translated into somewhat lower relative external vulnerability, as shown by the nominal effective exchange rate being broadly stable since mid-2014. However, the current account is expected to remain weaker than the norm (estimated at about -2 percent of GDP) throughout the medium term as competitiveness remains weak. Gross external financing requirements are projected to remain elevated and the balance of payments would continue to rely mainly on non-foreign direct investment (FDI) flows. After declining to 5 percent in 2015 on lower oil prices, inflation is projected to rebound to 6.1 percent in 2016.
3. Downside risks continue to prevail. The main risks include: on the domestic front, further delays in easing electricity shortages, policy and regulatory uncertainties, and renewed labor tensions; on the external front, a surge in global financial volatility, and a protracted period of slower global growth. On the upside, the electricity situation could improve faster than anticipated and global growth could benefit more than expected from lower oil prices.
Policies
With potential growth estimated to have declined to 2–2.5 percent, alleviating electricity bottlenecks and implementing structural reforms are key to reviving growth and creating more jobs. Global growth will improve only modestly and the expected increase in U.S. interest rates could renew external financing pressures. Also, there is limited room for demand management policies.
Structural Reforms
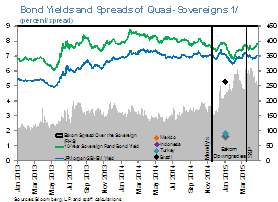
4. Solving the electricity crisis is the utmost priority. Severe electricity shortages, the worst since 2008, have become the greatest obstacle to growth, reducing economic activity, sapping confidence, and discouraging investment. Moody’s and S&P have downgraded Eskom to speculative grade despite the sovereign uplift and its spread over the sovereign has risen substantially in recent months and is large by EM standards. Measures taken, including establishment of an electricity “War Room” under the Deputy President to improve coordination and remove bottlenecks, the new management strategy, and the renewed emphasis on independent power producers and cogeneration are welcome. Higher electricity tariffs and the envisaged government support are necessary to make Eskom financially sustainable, but should be complemented by cost containment (including through improved procurement practices), efficiency enhancements, and governance improvements to minimize the impact on consumers and business costs. At the same time, consideration should be given to further private participation to increase capacity and reduce the cost of generation. Addressing other infrastructure bottlenecks, e.g. in transport, is important; the planned rail expansion is a step in the right direction.
5. Product and labor market reforms, and addressing skill mismatch. Some recent measures—for example, new regulation for visas for certain skilled workers and restrictions on temporary employment—risk depressing growth and job creation. Long-standing recommendations for reforms in these areas remain essential for sustainably higher, job-rich growth.1 Better quality education and training and more liberal immigration policies would ease skills mismatch. Reducing the regulatory burden and strengthening competition, including through trade liberalization, will help reduce the wage-productivity gap by lowering the cost of living and enhancing productivity. Simultaneous labor market reforms—giving more consideration to the unemployed and small firms in wage setting, exempting small and medium enterprises (SMEs) from the extension of collective bargaining outcomes, and reducing firing costs—will increase job creation and facilitate new firms’ entry. A renewed impetus for reforms in this direction is urgently needed. The government should give weight to the interests of those not represented in the collective bargaining processes to achieve the best social outcome. For example, in the debate on the envisaged minimum wage, government should take care to balance social protection and job creation. Progress made on the renewal of the Africa Growth and Opportunity Act, if confirmed, is positive for exports and jobs. The authorities are also pursuing regional free trade arrangements that could help South Africa benefit more from the dynamism of the continent. Other potential positive steps that could be taken in the short term include facilitating the process for allocating visas to skilled workers, measures to achieve more stable industrial relations (e.g. secret strike ballots), and tangible progress in port tariff reductions and lowering information and communication technology costs.
Fiscal Policy
6. The 2015 Budget. The Budget rightly adjusts to lower potential growth and increases revenue, but further measures and reforms are needed to address risks and make fiscal policy more supportive of long-term growth and jobs. The structural primary balance is projected to improve by 1 percent of GDP over three years. This, coupled with GDP rebasing, a better-than-anticipated FY14/15 outcome, and lower budgeted transfers to the Southern African Customs Union (SACU) countries, should stabilize debt at about 50 percent of GDP by FY19/20 (lower than the 56 percent of GDP projected in the 2014 Article IV and close to the 2015 Budget).2 But the planned sharp deceleration in spending growth in FY16/17 and the use of the contingency reserve to accommodate higher public wages makes achieving the authorities’ targets a tall order. Additional substantial fiscal risks stem from further support to Eskom, lower growth, and the fiscal impact of the public sector wage agreement. The planned national health insurance (NHI) could add to spending pressures and the envisaged nuclear power plants could entail a large public debt increase. The decline in SACU revenue could have significant implications for recipient countries, especially those for whom these transfers represent a high share of revenue, underscoring the importance of close engagement within the currency union.
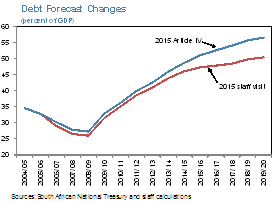
7. Addressing fiscal risks. The Treasury has made significant progress in its analysis of fiscal risks. Also, National Treasury’s increased monitoring of SOEs is welcome and could help identify ways in which their performance can be strengthened. It would be prudent to smooth the consolidation path, including by taking advantage of lower 2015 inflation to further contain nominal spending growth beyond what is envisaged in the Budget. Consideration should be given to raising consumption taxes, which are low by international standards, to ensure a sufficient revenue base to face forthcoming spending commitments, notably the NHI, and to bring debt toward safer levels.
8. Enhancing spending efficiency remains critical. Ongoing efforts to strengthen government procurement, including making smarter use of technology to simplify bidding and increase transparency, and standardization of government contracts to reduce costs, are welcome. While the emphasis on integrating SMEs into the public supply chain should help level the playing field, procurement should remain focused on value for money. In addition, spending reviews and performance-based budgeting would improve the impact of government programs. While the public sector wage settlement averts a costly strike, it keeps compensation budgets high and could crowd out higher-impact social and capital expenditure, underscoring the importance of the comprehensive review of compensation budgets announced in the 2015 Budget. A review of tax expenditures could also help eliminate ineffective spending, creating space for priority programs. All these reforms that improve public service delivery would be positive for jobs and growth.
Monetary Policy
9. Monetary policy may have some breathing space. We project year-on-year inflation to accelerate, breaching the upper end of the target band in 2015: Q4-2016: Q1, easing to 5.5 percent by end 2016. The temporary breach of the South African Reserve Bank’s (SARB) inflation target is driven by base effects from higher fuel prices, and electricity tariff increases. As the SARB has noted, monetary policy should generally only address second-round effects of supply-side shocks. The output gap remains negative (1-1.5 percent) and demand pressures subdued. There is significant uncertainty about the timing and pace of Fed tightening, the extent of rand depreciation, and the degree of pass-through. In sum, the SARB could stay on hold unless core inflation or inflation expectations rise, or external financing becomes problematic. The current inflation outlook presents communication challenges and puts a premium on explaining to the broader public the drivers of rising inflation. In that context, the announced publication of the assumptions underlying the SARB’s inflation forecast is helpful.
Enhancing resilience
10. Building larger external buffers. Domestic capital markets are mainly linked to U.S. financial conditions, which are expected to tighten. The possibility of significant market volatility associated with higher U.S. policy rates poses risks for EMs with high gross external financing requirements like South Africa. In addition, commodity prices remain volatile. In this context, strengthening external buffers is important. Official reserves ($47bn in May) are relatively low by EM standards and below the revised IMF reserve adequacy metric by $13–19bn. The authorities should give consideration to pre-announced small regular foreign exchange purchases that would not interfere with the floating exchange rate regime. In addition, while capital flows remain volatile, there could be opportunities to purchase small amounts of foreign exchange during risk-on episodes. The SARB’s recent swap agreement with the People’s Bank of China is a positive development. The authorities could continue to explore other options to build external buffers and improve the funding mix, including multilateral and official financing, and swap arrangements.
11. Strengthening the financial safety net. As the 2014 Financial System Stability Assessment (FSSA) notes, financial sector risks and vulnerabilities are elevated but manageable. Recently, as observed globally, market and liquidity risk have moderately risen and equity valuations are fairly high. Credit risk has remained broadly stable, but continued high scrutiny is warranted. Households are slowly deleveraging though debt service ratios have inched up, while credit growth to corporates has been vigorous and partly funded by banks’ foreign loans. The recent approval of amendments to the Bank Act and the issuance of a second draft of the Financial Sector Regulation Bill are welcome. The FSSA recommendations to strengthen the bank resolution framework, and introduce deposit insurance and variable net asset value for money market funds remain important to further improve the financial safety net and reduce systemic liquidity risk.
12. The next Article IV consultation with South Africa is likely to take place in early 2016.
| South Africa: Selected Economic Indicators, 2011–16 | ||||||||||||||
| Social Indicators | ||||||||||||||
|
GDP |
Poverty | |||||||||||||
|
Nominal GDP (2014, billions of U.S. dollars) |
350 |
Headcount ratio at $1.25 a day (2011, percent of population) |
9.4 | |||||||||||
|
GDP per capita (2014, U.S. dollars) |
6483 |
Undernourishment (2012, percent of population) |
5.0 | |||||||||||
|
Population characteristics (2014) |
Income distribution (2011) |
|||||||||||||
|
Total |
54.0 |
Income share held by highest 10 percent of population |
53.8 | |||||||||||
|
Urban population (percent of total) |
64 |
Income share held by lowest 20 percent of population |
2.5 | |||||||||||
|
Life expectancy at birth (years), 2014 |
61 |
Gini index |
65.0 | |||||||||||
| Economic Indicators | ||||||||||||||
| 2011 | 2012 | 2013 | 2014 | 2014 | 2016 | |||||||||
| Proj. | ||||||||||||||
|
National income and prices (annual percentage change unless otherwise indicated) |
||||||||||||||
|
Real GDP |
3.2 | 2.2 | 2.2 | 1.5 | 2.0 | 2.1 | ||||||||
|
Real GDP per capita |
1.7 | 0.7 | 0.6 | -0.1 | 0.4 | 0.5 | ||||||||
|
Real domestic demand |
5.1 | 3.8 | 2.7 | 1.1 | 1.7 | 1.9 | ||||||||
|
GDP deflator |
6.7 | 5.5 | 6.0 | 5.8 | 5.4 | 5.8 | ||||||||
|
CPI (annual average) |
5.0 | 5.7 | 5.8 | 6.1 | 5.0 | 6.1 | ||||||||
|
CPI (end of period) |
6.1 | 5.7 | 5.4 | 5.3 | 6.1 | 5.5 | ||||||||
|
Labor market (annual percentage change unless otherwise indicated) |
||||||||||||||
|
Unemployment rate (percent of labor force, annual average) |
24.8 | 24.9 | 24.7 | 25.1 | 25.7 | 25.5 | ||||||||
|
Savings and Investment (percent of GDP unless otherwise indicated) |
||||||||||||||
|
Gross national saving |
17.0 | 15.1 | 14.4 | 14.9 | 16.0 | 16.6 | ||||||||
|
Investment (including inventories) |
19.1 | 20.1 | 20.1 | 20.4 | 20.8 | 21.6 | ||||||||
|
Fiscal position (percent of GDP unless otherwise indicated) 1/ |
||||||||||||||
|
Revenue, including grants |
27.0 | 27.2 | 27.6 | 28.2 | 29.1 | 29.4 | ||||||||
|
Expenditure and net lending |
30.9 | 31.3 | 31.7 | 32.0 | 32.9 | 32.5 | ||||||||
|
Overall balance |
-3.9 | -4.1 | -4.1 | -3.8 | -3.8 | -3.2 | ||||||||
|
Primary balance |
-1.2 | -1.3 | -1.1 | -0.7 | -0.6 | 0.2 | ||||||||
|
Structural balance (percent of potential GDP) |
-3.5 | -3.9 | -3.8 | -3.4 | -3.3 | -2.7 | ||||||||
|
Gross government debt 2/ |
37.6 | 40.5 | 43.3 | 45.5 | 47.0 | 47.5 | ||||||||
|
Government bond yield (10-year, percent) 3/ |
8.3 | 7.6 | 7.3 | 7.9 | 8.2 | … | ||||||||
|
Money and credit (annual percentage change unless otherwise indicated) |
||||||||||||||
|
Broad money |
8.3 | 5.2 | 5.9 | 7.2 | 7.8 | 8.5 | ||||||||
|
Credit to the private sector |
5.7 | 9.3 | 6.6 | 8.8 | 8.2 | 8.3 | ||||||||
|
Repo rate (percent, end-period) 3/ |
5.5 | 5.0 | 5.0 | 5.8 | 5.8 | … | ||||||||
|
3-month Treasury bill interest rate (percent) 3/ |
5.5 | 5.3 | 5.1 | 5.8 | 5.7 | … | ||||||||
|
Balance of payments (percent of GDP unless otherwise indicated) |
||||||||||||||
|
Current account balance (billions of U.S. dollars) |
-9.0 | -19.7 | -21.1 | -19.1 | -15.4 | -16.5 | ||||||||
|
percent of GDP |
-2.2 | -5.0 | -5.8 | -5.4 | -4.8 | -5.0 | ||||||||
|
Export growth (volume) |
4.3 | 0.1 | 4.6 | 2.6 | 3.4 | 3.0 | ||||||||
|
Import growth (volume) |
10.5 | 6.0 | 1.8 | -0.5 | 2.4 | 2.5 | ||||||||
|
Terms of trade (percentage change) |
4.4 | -1.4 | -5.4 | -1.9 | 1.3 | -1.9 | ||||||||
|
Gross reserves (billions of U.S. dollars) |
48.9 | 50.7 | 49.6 | 49.1 | 49.1 | 49.1 | ||||||||
|
percent of short-term debt (residual maturity) |
151.6 | 133.2 | 130.2 | 125.9 | 121.7 | 111.9 | ||||||||
|
Total external debt |
28.3 | 35.7 | 37.3 | 40.8 | 46.0 | 47.9 | ||||||||
|
Nominal effective exchange rate (percentage change, end-period) 4/ |
-16.6 | -5.4 | -15.3 | -2.7 | 5.5 | … | ||||||||
|
Real effective exchange rate (percentage change, end-period) 4/ |
-14.1 | -2.2 | -12.4 | 1.3 | 3.6 | … | ||||||||
|
Exchange rate (Rand/U.S. dollar, end-period) 3/ |
8.1 | 8.5 | 10.5 | 11.6 | 12.2 | … | ||||||||
|
Sources: South African Reserve Bank and National Treasury, Haver, Bloomberg, World Bank, IMF INS database, and Fund staff estimates and projections. | ||||||||||||||
|
1/ General government unless otherwise indicated. | ||||||||||||||
|
2/ National government. | ||||||||||||||
|
3/ Data for 2015 is for May. | ||||||||||||||
|
4/ Data for 2015 is for April. | ||||||||||||||
1 See South Africa National Development Plan, OECD Economic Survey of South Africa 2013, and 2014 IMF Country Report No 14/338 South Article IV Consultation-Staff Report. 2 See 2015 Budget Review. | ||||||||||||||||||||||||||||||||||||||||||||||||||||||||||||||||||||||||||||||||||||||||||||||||||||||||||||||||||||||||||||||||||||||||||||||||||||||||||||||||||||||||||||||||||||||||||||||||||||||||||||||||||||||||||||||||||||||||||||||||||||||||||||||||||||||||||||||||||||||||||||||||||||||||||||||||||||||||||||||||||||||||||||||||||||||||||||||||||||||||||||||||||||||||||||||||||||||||||||||||||||||||||||||||||||||||||||||||||||||||||||||||||||||||||||||||||||||||||||||||||||||||||||||||||||||||||||||||||||||||||||||||||||||||||||||||||||||||||||||||||||||||||||
IMF COMMUNICATIONS DEPARTMENT
| Public Affairs | Media Relations | |||
|---|---|---|---|---|
| E-mail: | publicaffairs@imf.org | E-mail: | media@imf.org | |
| Fax: | 202-623-6220 | Phone: | 202-623-7100 | |


