

Loading component...
World Economic Outlook
Legacies, Clouds, Uncertainties
October 2014

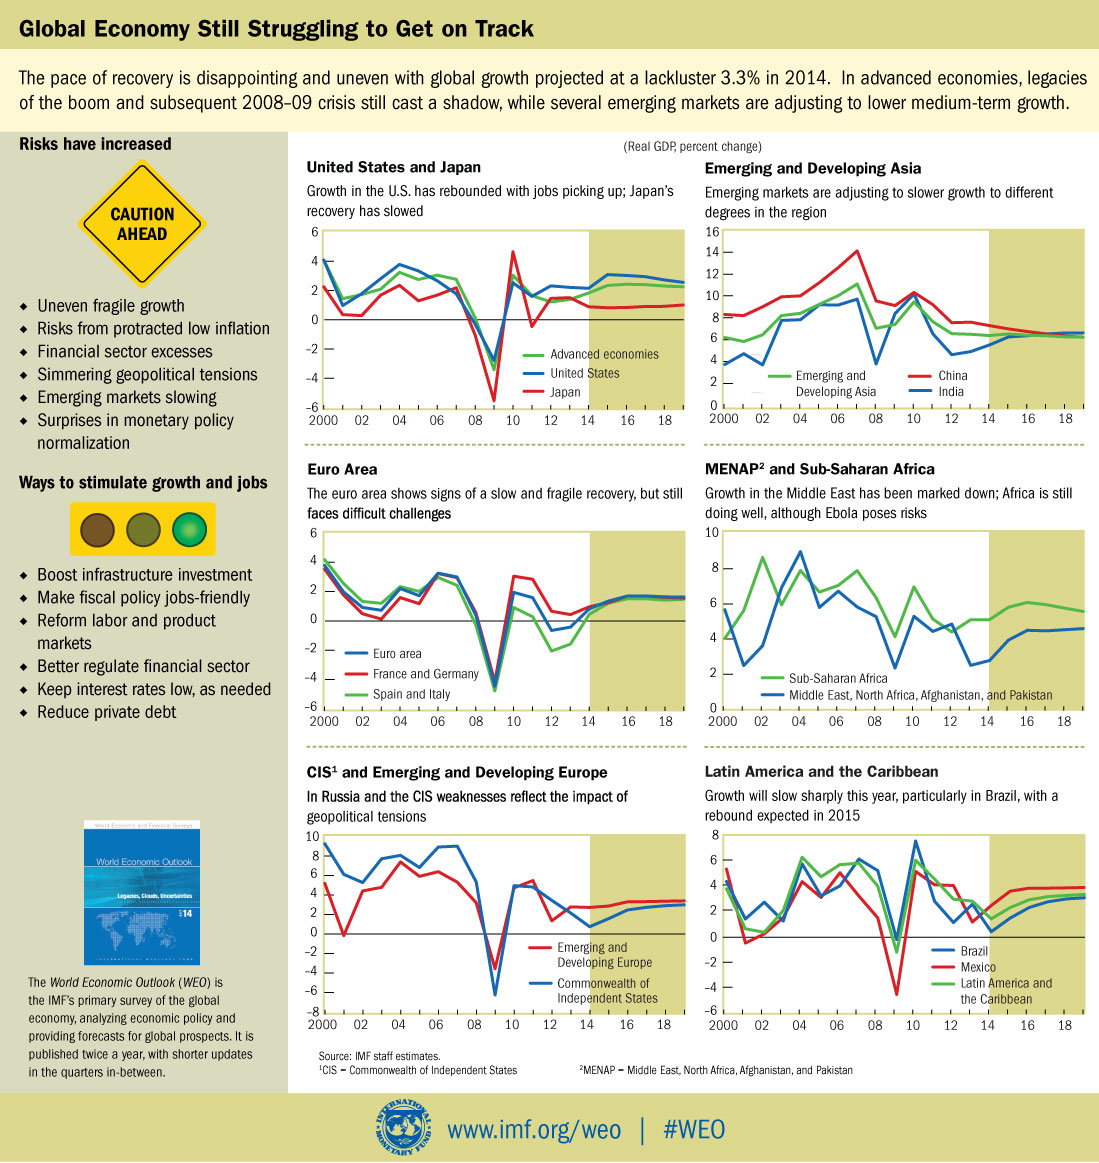
Despite setbacks, an uneven global recovery continues. Largely due to weaker-than-expected global activity in the first half of 2014, the growth forecast for the world economy has been revised downward to 3.3 percent for this year, 0.4 percentage point lower than in the April 2014 World Economic Outlook (WEO). The global growth projection for 2015 was lowered to 3.8 percent.
Downside risks have increased since the spring. Shortterm risks include a worsening of geopolitical tensions and a reversal of recent risk spread and volatility compression in financial markets. Medium-term risks include stagnation and low potential growth in advanced economies and a decline in potential growth in emerging markets.
Given these increased risks, raising actual and potential growth must remain a priority. In advanced economies, this will require continued support from monetary policy and fiscal adjustment attuned in pace and composition to supporting both the recovery and longterm growth. In a number of economies, an increase in public infrastructure investment can also provide support to demand in the short term and help boost potential output in the medium term. In emerging markets, the scope for macroeconomic policies to support growth if needed varies across countries and regions, but space is limited in countries with external vulnerabilities. And in advanced economies as well as emerging market and developing economies, there is a general, urgent need for structural reforms to strengthen growth potential or make growth more sustainable.
| Boxes | |||
| 1.1 | Housing Markets across the Globe: An Update | ||
| 1.2 | The Origins of IMF Growth Forecast Revisions since 2011 | ||
| 1.SF.1 | The Trade Implications of the U.S. Shale Gas Boom | ||
| Tables | |||
| 1.1 | Overview of the World Economic Outlook Projections | ||
| 1.SF.1 | World Fossil Fuel Reserves, Production, and Consumption | ||
| 1.SF.2 | Natural Gas Reserves, Production, and Consumption, by Country | ||
| 1.SF.1.1. | Regression Results | ||
| 1.1.1 | IMF Assessments of Housing Market Developments in Rebound Economies | ||
| 1.2.1 | Contribution to Global Growth Forecast Error | ||
| Figures | |||
| Chart | Data | 1.1 | Global Activity Indicators |
| Chart | Data | 1.2 | Global Inflation |
| Chart | Data | 1.3 | Monetary Conditions in Advanced Economies |
| Chart | Data | 1.4 | Financial Market Conditions in Advanced Economies |
| Chart | Data | 1.5 | Financial Market Conditions and Capital Flows in Emerging Market Economies |
| Chart | Data | 1.6 | Fiscal Policies |
| Chart | Data | 1.7 | Monetary Policies and Credit in Emerging Market Economies |
| Chart | Data | 1.8 | GDP Growth Forecasts |
| Chart | Data | 1.9 | External Sector |
| Chart | Data | 1.10 | Exchange Rates and Reserves |
| Chart | Data | 1.11 | Risks to the Global Outlook |
| Chart | Data | 1.12 | Recession and Deflation Risks |
| Chart | Data | 1.13 | Iraq Oil Shock |
| Chart | Data | 1.14 | Secular Stagnation |
| Chart | Data | 1.15 | Capacity, Unemployment, and Output Trends |
| Chart | Data | 1.SF.1 | Commodity Market Developments |
| Chart | Data | 1.SF.2 | Balance of Risks |
| Chart | Data | 1.SF.3 | Natural Gas Prices |
| Chart | 1.SF.4 | Liquefied Natural Gas Imports and Exports, 2013 | |
| Chart | Data | 1.SF.5 | United States: Liquefied Natural Gas Imports |
| Chart | Data | 1.SF.6 | Impulse Response of Relative Industrial Production to a Unit Relative Natural Gas Price Shock |
| Chart | Data | 1.SF.7 | Japan: Liquefied Natural Gas Imports |
| Chart | Data | 1.SF.8 | Japan: Liquefied Natural Gas Imports by Region |
| Chart | Data | 1.SF.1.1. | Manufacturing Sector Exports |
| Chart | Data | 1.1.1 | IMF Global House Price Index |
| Chart | Data | 1.1.2 | Two-Speed Recovery in Housing Markets |
| Chart | Data | 1.1.3 | Construction Gross Value Added and Residential Investment |
| Chart | Data | 1.1.4 | Use of Macroprudential Tools to Manage Housing Booms |
| Chart | Data | 1.2.1 | Growth Forecast Errors by Region, 2011–13 |
| Chart | Data | 1.2.2 | Partner-Country versus Domestic Growth Forecast Error |
| Chart | Data | 1.2.3 | Growth Forecast Error versus Lagged Growth Forecast Error |
| Chart | Data | 1.2.4 | Growth and Forecast Revisions in Major Economies |
| Tables | |||
| 2.1 | Selected Advanced Economies: Real GDP, Consumer Prices, Current Account Balance, and Unemployment | ||
| 2.2 | Selected European Economies: Real GDP, Consumer Prices, Current Account Balance, and Unemployment | ||
| 2.3 | Selected Asian Economies: Real GDP, Consumer Prices, Current Account Balance, and Unemployment | ||
| 2.4 | Selected Western Hemisphere Economies: Real GDP, Consumer Prices, Current Account Balance, and Unemployment | ||
| 2.5 | Commonwealth of Independent States: Real GDP, Consumer Prices, Current Account Balance, and Unemployment | ||
| 2.6 | Selected Middle East and North African Economies: Real GDP, Consumer Prices, Current Account Balance, and Unemployment | ||
| 2.7 | Selected Sub-Saharan African Economies: Real GDP, Consumer Prices, Current Account Balance, and Unemployment | ||
| Figures | |||
| Chart | Data | 2.1 | 2015 GDP Growth Forecasts and the Effects of a Plausible Downside Scenario |
| Chart | Data | 2.2 | The United States and Canada: Recovery to Continue after a Temporary Setback |
| Chart | Data | 2.3 | Advanced Europe: At Different Stages of Recovery |
| Chart | Data | 2.4 | Emerging and Developing Europe: Domestic Demand Taking Hold |
| Chart | Data | 2.5 | Asia and Pacific: Steady Growth Ahead |
| Chart | Data | 2.6 | Latin America and the Caribbean: Still Losing Speed |
| Chart | Data | 2.7 | Commonwealth of Independent States: Coping with Geopolitical Uncertainties |
| Chart | Data | 2.8 | The Middle East, North Africa, Afghanistan, and Pakistan: Fragile Recovery |
| Chart | Data | 2.9 | Sub-Saharan Africa: Maintaining Speed |
| Chart | Data | 2.SF.1 | Implied Volatility |
| Chart | Data | 2.SF.2 | Drivers of U.S. Yields |
| Chart | Data | 2.SF.3 | Spillovers from U.S. Money and Real Shocks |
| Chart | Data | 2.SF.4 | United States: Average Response of Industrial Production after Varying Intervals |
| Chart | Data | 2.SF.5 | Spillovers from U.S. Money and Real Shocks by Country Group |
| Appendixes | |||
| 3.1 | Data Sources and Country Groupings | ||
| 3.2 | The Macroeconomic Effects of Public Investment | ||
| Boxes | |||
| 3.1 | Public Investment in Japan during the Lost Decade | ||
| 3.2 | Improving the Efficiency of Public Investment | ||
| 3.3 | Fiscal Balance Sheets: The Significance of Nonfinancial Assets and Their Measurement | ||
| 3.4 | The Macroeconomic Effects of Scaling Up Public Investment in Developing Economies | ||
| 3.5 | Fiscal Institutions, Rules, and Public Investment | ||
| Tables | |||
| 3.1 | Elasticity of Output to Public Capital | ||
| 3.2 | Economy Group Composition | ||
| 3.3 | Data Sources | ||
| 3.4 | Effect of Public Investment on Output in Advanced Economies: Robustness Checks | ||
| 3.5 | Effect of Public Investment on Output in Emerging Market and Developing Economies: Public Investment Shocks Derived from a Fiscal Policy Rule | ||
| 3.6 | Effects of Public Investment on Output in Emerging Market and Developing Economies: Public Investment Instrumented by Predicted Official Loan Disbursement | ||
| 3.3.1 | Summary Classification of Nonfinancial Assets | ||
| Figures | |||
| Chart | Data | 3.1 | WEO Medium-Term Growth Projections |
| Chart | Data | 3.2 | Evolution of Public Capital Stock and Public Investment |
| Chart | Data | 3.3 | Physical Measures of Infrastructure |
| Chart | Data | 3.4 | Quality of Infrastructure in G7 Economies |
| Chart | Data | 3.5 | Effect of Public Investment in Advanced Economies |
| Chart | Data | 3.6 | Effect of Public Investment in Advanced Economies: Role of Economic Conditions, Efficiency, and Mode of Financing |
| Chart | Data | 3.7 | Output and Public Debt in the Aftermath of Public Investment Booms |
| Chart | Data | 3.8 | Effect of Public Investment on Output in Emerging Market and Developing Economies |
| Chart | Data | 3.9 | Model Simulations: Effect of Public Investment in Advanced Economies in the Current Scenario |
| Chart | Data | 3.10 | Model Simulations: Effect of Public Investment in Advanced Economies––Role of Monetary Policy, Efficiency, and Return on Public Capital |
| Chart | Data | 3.11 | Model Simulations: Effect of Public Investment in Advanced Economies and Emerging Markets |
| Chart | Data | 3.12 | Evolution of Public Capital Stock and Public Investment |
| Chart | Data | 3.13 | Effect of Public Investment Shocks on Output, Recessions versus Expansions: Robustness Checks |
| Chart | Data | 3.14 | Effect of Public Investment Shocks on Output, High versus Low Efficiency: Robustness Checks |
| Chart | Data | 3.15 | Effect of Changes in Public Investment in Advanced Economies |
| Chart | Data | 3.16 | Distribution of Public Investment Booms over Time |
| Chart | Data | 3.17 | Output and Public Debt in the Aftermath of Public Investment Booms: Robustness Checks |
| Chart | Data | 3.18 | Output and Public Debt in the Aftermath of Public Investment Booms: Role of Natural Resources |
| Chart | Data | 3.1.1 | Japan: Public Investment and Growth |
| Chart | Data | 3.1.2 | Japan: Budget and Implementation of Public Investment |
| Chart | Data | 3.2.1 | Public Efficiency Measured by Efficiency Frontiers |
| Chart | Data | 3.2.2 | Public Investment Management Index Scores in Emerging Markets and Low-Income Countries |
| Chart | Data | 3.3.1 | General Government Assets and Liabilities, 2012 |
| Chart | Data | 3.4.1 | Role of Type of Financing in Scaling Up Public Investment in Low-Income Countries |
| Chart | Data | 3.4.2 | Role of Improving Public Investment Efficiency in Low-Income Countries |
| Chart | Data | 3.5.1 | Fiscal Policies and Public Investment |
| Appendixes | |||
| 4.1 | Data Definitions, Sources, and Descriptions | ||
| 4.2 | Panel Estimations | ||
| 4.3 | Distortions, Policies, and Imbalances | ||
| 4.4 | Counterfactual Output Gap Analysis | ||
| 4.5 | Vulnerability Thresholds | ||
| Boxes | |||
| 4.1 | Switching Gears: The 1986 External Adjustment | ||
| 4.2 | A Tale of Two Adjustments: East Asia and the Euro Area | ||
| Tables | |||
| 4.1 | Largest Deficit and Surplus Economies, 2006 and 2013 | ||
| 4.2 | Largest Debtor and Creditor Economies (Net Foreign Assets and Liabilities), 2006 and 2013 | ||
| 4.3 | Decomposition of Changes in Net Foreign Assets between 2006 and 2013 | ||
| 4.4 | Data Sources | ||
| 4.5 | Sample Economies | ||
| 4.6 | Panel Regression Results, 1970–2013 | ||
| 4.7 | Panel Regression Results, 2007–13 | ||
| 4.8 | Estimated Threshold Values and Associated Classification Errors | ||
| 4.1.1 | Largest Deficit and Surplus Economies, 1986 and 1991 | ||
| 4.1.2 | Panel Regression Results, Post–Plaza Accord versus Post–2006 Current Account Adjustments | ||
| Figures | |||
| Chart | Data | 4.1 | Global Current Account (“Flow”) Imbalances |
| Chart | Data | 4.2 | Largest Deficit Economies, 2006 and 2013 |
| Chart | Data | 4.3 | Largest Surplus Economies, 2006 and 2013 |
| Chart | Data | 4.4 | Key Indicators of External Adjustment, 2006 Episode |
| Chart | Data | (continued) | |
| Chart | Data | 4.5 | Growth of Domestic Demand Relative to Trading Partners versus 2006 Current Account |
| Chart | Data | 4.6 | Change in Real Effective Exchange Rate (CPI Based) versus 2006 Current Account |
| Chart | Data | 4.7 | Changes in Domestic Demand and Current Account |
| Chart | Data | 4.8 | Changes in Real Effective Exchange Rate and Current Account |
| Chart | Data | 4.9 | Current Account Balances, Cyclically Adjusted and Unadjusted |
| Chart | Data | 4.10 | Largest Deficit and Surplus Economies: Current Account Gaps |
| Chart | Data | 4.11 | Understanding Changes in Distortions Using External Balance Assessment Regressions, 2006 versus 2013 |
| Chart | Data | 4.12 | Global Net Foreign Assets (“Stock”) Imbalances |
| Chart | Data | 4.13 | Gross Foreign Assets and Liabilities |
| Chart | Data | 4.14 | Adjustment in Net Foreign Assets versus Current Account Balance |
| Chart | Data | 4.15 | Global Current Account Imbalances |
| Chart | Data | 4.16 | Global Net Foreign Asset Imbalances |
| Chart | Data | 4.17 | Determining Net Foreign Asset Sustainability |
| Chart | Data | 4.18 | Largest Deficit/Debtor Economies: Current Account versus Net Foreign Assets, 2006, 2013, and 2019 |
| Chart | Data | 4.1.1 | Global Current Account Imbalances in Absolute Terms |
| Chart | Data | 4.1.2 | Historical Decomposition of Current Account Adjustment |
| Chart | Data | 4.2.1 | Current Account Balances |
| Chart | Data | 4.2.2 | Real GDP |
| Chart | Data | 4.2.3 | Real Domestic Demand Growth |
| Chart | Data | 4.2.4 | Real External Demand Growth |
| Chart | Data | 4.2.5 | Real Effective Exchange Rates (CPI-Based) |
| Chart | Data | 4.2.6 | Exports and Imports as a Share of GDP |
| Chart | Data | 4.2.7 | Real Exports, Imports, and Foreign GDP |
| List of Tables Part A (Download PDF) | |||
| A1. | Summary of World Output | ||
| A2. | Advanced Economies: Real GDP and Total Domestic Demand | ||
| A3. | Advanced Economies: Components of Real GDP | ||
| A4. | Emerging Market and Developing Economies: Real GDP | ||
| A5. | Summary of Inflation | ||
| A6. | Advanced Economies: Consumer Prices | ||
| A7. | Emerging Market and Developing Economies: Consumer Prices | ||
| A8. | Major Advanced Economies: General Government Fiscal Balances and Debt | ||
| A9. | Summary of World Trade Volumes and Prices | ||
| A10. | Summary of Current Account Balances | ||
| A11. | Advanced Economies: Balance on Current Account | ||
| A12. | Emerging Market and Developing Economies: Balance on Current Account | ||
| A13. | Summary of Financial Account Balances | ||
| A14. | Summary of Net Lending and Borrowing | ||
| A15. | Summary of World Medium-Term Baseline Scenario | ||
| List of Tables Part B (Download PDF - available on the web only) | |||
| B1. | Advanced Economies: Unemployment, Employment, and Real GDP per Capita | ||
| B2. | Emerging Market and Developing Economies: Real GDP | ||
| B3. | Advanced Economies: Hourly Earnings, Productivity, and Unit Labor Costs in Manufacturing | ||
| B4. | Emerging Market and Developing Economies: Consumer Prices | ||
| B5. | Summary of Fiscal and Financial Indicators | ||
| B6. | Advanced Economies: General and Central Government Net Lending/Borrowing and Excluding Social Security Schemes | ||
| B7. | Advanced Economies: General Government Structural Balances | ||
| B8. | Emerging Market and Developing Economies: General Government Net Lending/ Borrowing and Overall Fiscal Balance | ||
| B9. | Emerging Market and Developing Economies: General Government Net Lending/ Borrowing | ||
| B10. | Advanced Economies: Exchange Rates | ||
| B11. | Emerging Market and Developing Economies: Broad Money Aggregates | ||
| B12. | Advanced Economies: Export Volumes, Import Volumes, and Terms of Trade in Goods and Services | ||
| B13. | Emerging Market and Developing Economies by Region: Total Trade in Goods | ||
| B14. | Emerging Market and Developing Economies by Source of Export Earnings: Total Trade in Goods | ||
| B15. | Summary of Current Account Transactions | ||
| B16. | Summary of External Debt and Debt Service | ||
| B17. | Emerging Market and Developing Economies by Region: External Debt by Maturity and Type of Creditor | ||
| B18. | Emerging Market and Developing Economies by Analytical Criteria: External Debt by Maturity and Type of Creditor | ||
| B19. | Emerging Market and Developing Economies: Ratio of External Debt to GDP | ||
| B20. | Emerging Market and Developing Economies: Debt-Service Ratios | ||
| B21. | Emerging Market and Developing Economies, Medium-Term Baseline Scenario: Selected Economic Indicators | ||
| World Economic Outlook, Selected Topics | |||
 October 2014
 Podcast
 Database
 Discussion Forum
 Frequently Asked Questions
 Subscribe
