Typical street scene in Santa Ana, El Salvador. (Photo: iStock)
IMF Survey: New Way to Visualize IMF Data
January 10, 2008
- IMF introduces new interactive data tool
- Tool improves accessibility of IMF data
- New version with more data to be released in early 2008
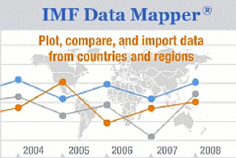
The IMF Data Mapper, a new interactive data visualization tool on the IMF's website, allows web users to select data across countries, regions, and groups at the click of a mouse.

Cathy Wright of the IMF's Statistics Department calls this new interactive data tool "a significant step toward making the Fund's data more accessible to users."
DATA INTERACTIVITY
The first version of the IMF Data Mapper, a new interactive data visualization tool, is now available on www.imf.org. Users can select and compare data across countries, regions, and groups, using the world map or a pull-down menu.
The Data Mapper displays the selected data in chart form, and the map and charts are interactive. For example, changing the time period by sliding along the time axis on a line chart causes the annual data displayed on the map and the map colors to change. The data can also be printed or exported to other applications in the form of chart or map images.
This initial version of the Mapper—launched with the release of the October 2007 World Economic Outlook (WEO)—contains selected data from the latest WEO and from the newly released Balance of Payments Yearbook 2007.
"This is a significant step toward making the Fund's data more accessible to users," says Cathy Wright of the IMF's Statistics Department, which helped develop the product. The Data Mapper—part of a broader initiative to improve dissemination of the IMF's data and forecasts—attracted interest at the London Online Information Show in December 2007, where the IMF had a booth.
More data coming soon
The second version of the application will be released in the first half of 2008 and will contain improved chart capabilities as well as enhanced presentation features—allowing the user to link key messages to map/chart combinations and to compare variables over time in a playback mode.
In addition, the data will be expanded to include additional variables and other databases, including from the IMF's Regional Economic Outlooks and its Government Finance Statistics Yearbook, as well as the OECD's Main Economic Indicators. The Data Mapper will also be made available from IMF.Stat—a central repository for internal and external economic data and metadata—which is currently under development.


