

Finance & Development, September 2019, Vol. 56, No. 3 PDF version
The Rise of Phantom Investments
Empty corporate shells in tax havens undermine tax collection in advanced,
emerging market, and developing economies

According to official statistics, Luxembourg, a country of 600,000 people, hosts as much foreign direct investment (FDI) as the United States and much more than China. Luxembourg’s $4 trillion in FDI comes out to $6.6 million a person. FDI of this size hardly reflects brick-and-mortar investments in the minuscule Luxembourg economy. So is something amiss with official statistics or is something else at play?
FDI is often an important driver for genuine international economic integration, stimulating growth and job creation and boosting productivity through transfers of capital, skills, and technology. Therefore, many countries have policies to attract more of it. However, not all FDI brings capital in service of productivity gains. In practice, FDI is defined as cross-border financial investments between firms belonging to the same multinational group, and much of it is phantom in nature—investments that pass through empty corporate shells. These shells, also called special purpose entities, have no real business activities. Rather, they carry out holding activities, conduct intrafirm financing, or manage intangible assets—often to minimize multinationals’ global tax bill. Such financial and tax engineering blurs traditional FDI statistics and makes it difficult to understand genuine economic integration.
'Double Irish with a Dutch sandwich'
Better data are needed to understand where, by whom, and why $40 trillion in FDI is being channeled around the world. Combining the Organisation for Economic Co-operation and Development’s detailed FDI data with the global coverage of the IMF’s Coordinated Direct Investment Survey, a new study (Damgaard, Elkjaer, and Johannesen, forthcoming) creates a global network that maps all bilateral investment relationships—disentangling phantom FDI from genuine FDI.
Interestingly, a few well-known tax havens host the vast majority of the world’s phantom FDI. Luxembourg and the Netherlands host nearly half. And when you add Hong Kong SAR, the British Virgin Islands, Bermuda, Singapore, the Cayman Islands, Switzerland, Ireland, and Mauritius to the list, these 10 economies host more than 85 percent of all phantom investments.
Why and how does this handful of tax havens attract so much phantom FDI? In some cases, it is a deliberate policy strategy to lure as much foreign investment as possible by offering lucrative benefits—such as very low or zero effective corporate tax rates. Even if the empty corporate shells have no or few employees in the host economy and do not pay corporate taxes, they still contribute to the local economy by buying tax advisory, accounting, and other financial services, as well as by paying registration and incorporation fees. For the tax havens in the Caribbean, these services account for the main share of GDP, alongside tourism.
In Ireland, the corporate tax rate has been lowered substantially from 50 percent in the 1980s to 12.5 percent today. In addition, some multinationals take advantage of loopholes in Irish law by using innovative tax engineering techniques with creative nicknames like “double Irish with a Dutch sandwich,” which involves transfers of profits between subsidiaries in Ireland and the Netherlands with tax havens in the Caribbean as the typical final destination. These tactics achieve even lower tax rates or avoid taxes altogether. Despite the tax cuts, Ireland’s revenues from corporate taxes have gone up as a share of GDP because the tax base has grown significantly, in large part from massive inflows of foreign investment. This strategy may be helpful to Ireland, but it erodes the tax bases in other economies. The global average corporate tax rate was cut from 40 percent in 1990 to about 25 percent in 2017, indicating a race to the bottom and pointing to a need for international coordination.
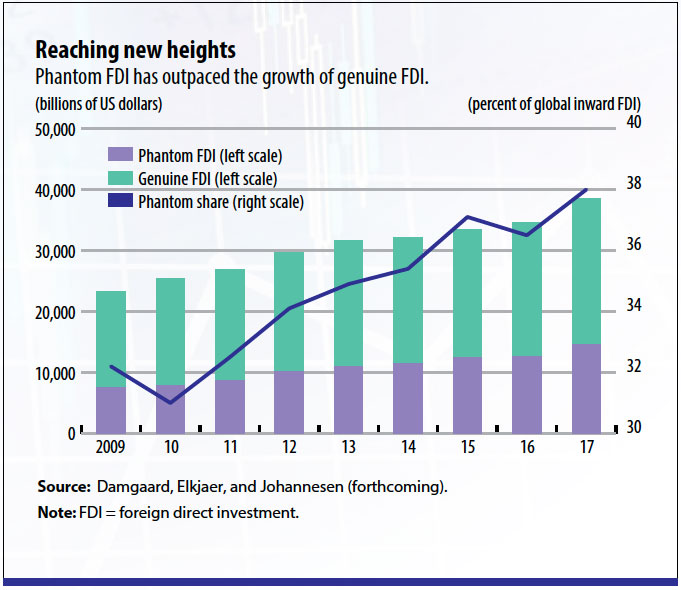
Globally, phantom investments amount to an astonishing $15 trillion, or the combined annual GDP of economic powerhouses China and Germany. And despite targeted international attempts to curb tax avoidance—most notably the G20 Base Erosion and Profit Shifting (BEPS) initiative and the automatic exchange of bank account information within the Common Reporting Standard (CRS)—phantom FDI keeps soaring, outpacing the growth of genuine FDI. In less than a decade, phantom FDI has climbed from about 30 percent to almost 40 percent of global FDI (see chart). This growth is unique to FDI. According to Lane and Milesi-Ferretti (2018), FDI positions have grown faster than world GDP since the global financial crisis, whereas cross-border positions in portfolio instruments and other investments have not.
While phantom FDI is largely hosted by a few tax havens, virtually all economies—advanced, emerging market, and low-income and developing—are exposed to the phenomenon. Most economies invest heavily in empty corporate shells abroad and receive substantial investments from such entities, with averages across all income groups exceeding 25 percent of total FDI.
Investments in foreign empty shells could indicate that domestically controlled multinationals engage in tax avoidance. Similarly, investments received from foreign empty shells suggest that foreign-controlled multinationals try to avoid paying taxes in the host economy. Unsurprisingly, an economy’s exposure to phantom FDI increases with the corporate tax rate.
Better data for better policies
Globalization creates new challenges for macroeconomic statistics. Today, a multinational company can use financial engineering to shift large sums of money across the globe, easily relocate highly profitable intangible assets, or sell digital services from tax havens without having a physical presence. These phenomena can hugely impact traditional macroeconomic statistics—for example, inflating GDP and FDI figures in tax havens. Prominent cases include Irish GDP growth of 26 percent in 2015, following some multinationals’ relocation of intellectual property rights to Ireland, and Luxembourg’s status as one of the world’s largest FDI hosts. To get better data on a globalized world, economic statistics also need to adapt.
The new global FDI network is useful to identify which economies host phantom investments and their counterparts, and it gives a clearer understanding of globalization patterns. Such data offer greater insight to analysts and can guide policymakers in their attempt to address international tax competition.
The taxation agenda has gained traction among the G20 economies in recent years. The BEPS and CRS initiatives are examples of the international community’s efforts to tackle weaknesses in the century-old tax design, but the issues of tax competition and taxing rights remain largely unaddressed. However, this seems to be changing with emerging widespread agreement on the need for significant reforms. Indeed, this year the IMF put forward various alternatives for a revised international tax architecture, ranging from minimum taxes to allocation of taxing rights to destination economies. No matter which road policymakers choose, one fact remains clear: international cooperation is the key to dealing with taxation in today’s globalized economic environment.
JANNICK DAMGAARD is currently advisor to the executive director in the IMF’s Office of the Nordic-Baltic Executive Director. Most of this research was carried out in his previous role as senior economist at the National Bank of Denmark. THOMAS ELKJAER is a senior economist in the IMF’s Statistics Department, and NIELS JOHANNESEN is a professor of economics at the University of Copenhagen’s Center for Economic Behaviour and Inequality.
The views expressed here are those of the authors; they do not necessarily reflect the views of the institutions with which they are affiliated.
References:
Damgaard, Jannick, Thomas Elkjaer, and Niels Johannesen. Forthcoming. “What Is Real and What Is Not in the Global FDI Network?” IMF Working Paper, International Monetary Fund, Washington, DC.
Lane, Philip R., and Gian Maria Milesi-Ferretti. 2018. “The External Wealth of Nations Revisited: International Financial Integration in the Aftermath of the Global Financial Crisis.” IMF Economic Review 66 (1): 189–222.
ART: ISTOCK / SLALOMP; FILBORG; SUESSE; SLAVICA
Opinions expressed in articles and other materials are those of the authors; they do not necessarily reflect IMF policy.