

World Economic Outlook
Adjusting to Lower Commodity Prices
September 2015
[$token_name="PublicationDisclaimer"]
Reports and Related Links:

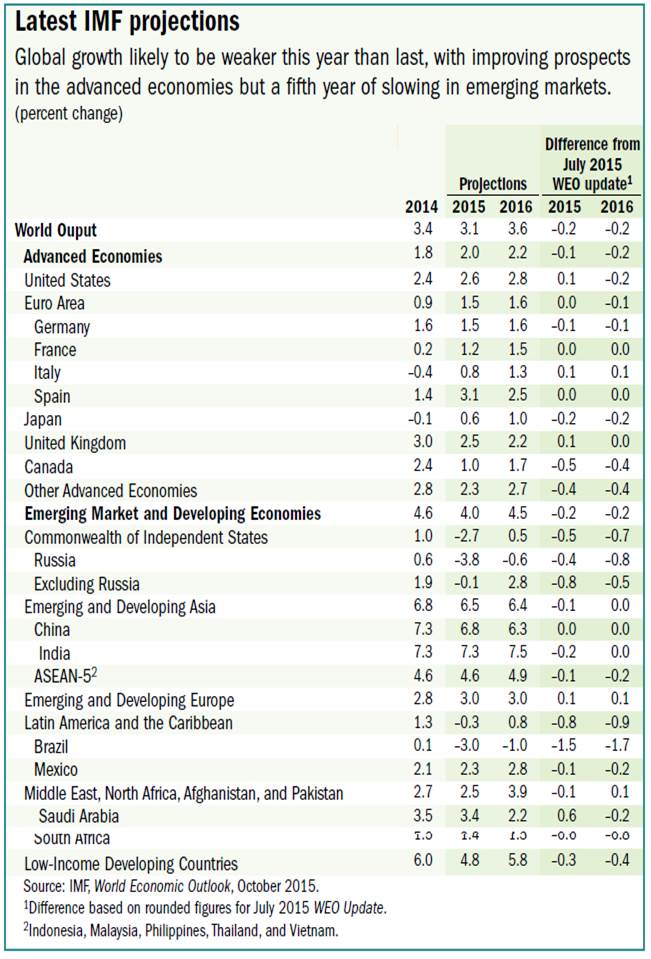
Global growth for 2015 is projected at 3.1 percent, 0.3 percentage point lower than in 2014, and 0.2 percentage point below the forecasts in the July 2015 World Economic Outlook (WEO) Update. Prospects across the main countries and regions remain uneven. Relative to last year, the recovery in advanced economies is expected to pick up slightly, while activity in emerging market and developing economies is projected to slow for the fifth year in a row, primarily reflecting weaker prospects for some large emerging market economies and oil-exporting countries. In an environment of declining commodity prices, reduced capital flows to emerging markets and pressure on their currencies, and increasing financial market volatility, downside risks to the outlook have risen, particularly for emerging market and developing economies.
Contents
Front Matter
Chapter 1. Recent Developments and Prospects
Global growth declined in the first half of 2015, reflecting a further slowdown in emerging markets and a weaker recovery in advanced economies. It is now projected at 3.1 percent for 2015 as a whole, slightly lower than in 2014, and 0.2 percentage point below the forecasts in the July 2015 World Economic Outlook (WEO) Update. Prospects across the main countries and regions remain uneven. Relative to last year, growth in advanced economies is expected to pick up slightly, while it is projected to decline in emerging market and developing economies. With declining commodity prices, depreciating emerging market currencies, and increasing financial market volatility, downside risks to the outlook have risen, particularly for emerging market and developing economies. Global activity is projected to gather some pace in 2016. In advanced economies, the modest recovery that started in 2014 is projected to strengthen further. In emerging market and developing economies, the outlook is projected to improve: in particular, growth in countries in economic distress in 2015 (including Brazil, Russia, and some countries in Latin America and in the Middle East), while remaining weak or negative, is projected to be higher next year, more than offsetting the expected gradual slowdown in China.

- Recent Developments and Prospects
- Risks
- Policies
- Special Feature: Commodity Market Developments and Forecasts, with a Focus on Metals in the World Economy
- References
| Annex | |||
| 1.1 | Regional Projections | ||
| Boxes | |||
| Scen.1 | A Structural Slowing in Emerging Market Economies | ||
| 1.1 | What Is the Effect of Recessions? | ||
| 1.2 | Small Economies, Large Current Account Deficits | ||
| 1.3 | Capital Flows and Financial Deepening in Developing Economies | ||
| 1.SF.1 | The New Frontiers of Metal Extraction: The North-to-South Shift | ||
| Tables | |||
| 1.1 | Overview of the World Economic Outlook Projections | ||
| 1.SF.1 | World Crude Steel Production, 2014 | ||
| 1.SF.2 | Metal Trade Evolution | ||
| 1.SF.3 | Net Metal Exports | ||
| 1.SF.1.1 | Impact of Political Institutions on Mineral Discoveries | ||
| 1.2.1 | Median Country Characteristics | ||
| 1.2.2 | Cross-Sectional Current Account Models | ||
| 1.2.2 | Profile of Countries with Large Current Account Deficits | ||
| 1.3.1 | Gross Capital Inflows and Private Credit: Two-State Least-Squares Estimates | ||
| Annex 1.1.1 |
European Economies: Real GDP, Consumer Prices, Current Account Balance, and Unemployment | ||
| Annex 1.1.2 |
Asian and Pacific Economies: Real GDP, Consumer Prices, Current Account Balance, and Unemployment | ||
| Annex 1.1.3 |
Western Hemisphere Economies: Real GDP, Consumer Prices, Current Account Balance, and Unemployment | ||
| Annex 1.1.4 |
Commonwealth of Independent States Economies: Real GDP, Consumer Prices, Current Account Balance, and Unemployment | ||
| Annex 1.1.5 |
Middle East and North African Economies, Afghanistan, and Pakistan: Real GDP, Consumer Prices, Current Account Balance, and Unemployment | ||
| Annex 1.1.6 |
Sub-Saharan African Economies: Real GDP, Consumer Prices, Current Account Balance, and Unemployment | ||
| Figures | |||
| Chart | Data | 1.1 | Global Activity Indicators |
| Chart | Data | 1.2 | Global Inflation |
| Chart | Data | 1.3 | Commodity and Oil Markets |
| Chart | Data | 1.4 | Financial Conditions in Advanced Economies |
| Chart | Data | 1.5 | Advanced Economies: Monetary Conditions |
| Chart | Data | 1.6 | Financial Conditions in Emerging Market Economies |
| Chart | Data | 1.7 | Monetary Policies and Credit in Emerging Market Economies |
| Chart | Data | 1.8 | Growth, Employment, and Labor Productivity in Advanced Economies |
| Chart | Data | 1.9 | Fiscal Policies |
| Chart | Data | 1.10 | GDP Growth Forecasts |
| Chart | Data | 1.11 | External Sector |
| Chart | Data | 1.12 | Capital Flows in Emerging Market Economies |
| Chart | Data | 1.13 | Real Exchange Rates and Current Account Gaps |
| Chart | Data | 1.14 | Risks to the Global Outlook |
| Chart | Data | 1.15 | Recession and Deflation Risks |
| Chart | Data | 1.1.1 | Advanced Economies: Real GDP |
| Chart | Data | 1.1.2 | Portugal: Evolution of Log Real GDP and Extrapolated Trends |
| Chart | Data | 1.2.1 | Sources of External Financing, Current Account Deficit Countries |
| Chart | Data | 1.2.2 | Composition of Net International Investment Position, Current Account Deficit Countries |
| Chart | Data | 1.3.1 | Gross Capital Inflows and Private Credit in Selected Low-Income Developing Countries |
| Chart | Data | Scen. Fig. 1 |
World Economic Outlook Stagnation Scenario |
| Chart | Data | 1.SF.1 | Commodity Market Developments |
| Chart | Data | 1.SF.2 | Metal Price Indices |
| Chart | Data | 1.SF.3 | Production and Consumption of Metals |
| Chart | Data | 1.SF.4 | Evolution of Metal Market |
| Chart | Data | 1.SF.5 | Development of Metal Market |
| Chart | Data | 1.SF.6 | China: Composition of Metal Use and Growth Rates by Sector |
| Chart | Data | 1.SF.7 | China: Metal Imports |
| Chart | Data | 1.SF.8 | Growth Rates of Metal Price Index |
| Chart | Data | 1.SF.1.1 | Metal Deposit Discoveries in Latin America and the Caribbean and Sub-Saharan Africa |
| Chart | Data | 1.SF.1.2 | Number of Metal Deposit Discoveries by Region and Decade |
Chapter 2. Where Are Commodity Exporters Headed? Output Growth in the Aftermath of the Commodity Boom
Commodity prices have declined sharply over the past three years, and output growth has slowed considerably among those emerging market and developing economies that are net exporters of commodities. A critical question for policymakers in these countries is whether commodity windfall gains and losses influence potential output or merely trigger transient fluctuations of actual output around an unchanged trend for potential output. The analysis in this chapter suggests that both actual and potential output move together with the commodity terms of trade but that actual output commoves twice as strongly as potential output. The weak commodity price outlook is estimated to subtract almost 1 percentage point annually from the average rate of economic growth in commodity exporters over 2015–17 as compared with 2012–14. In exporters of energy commodities, the drag is estimated to be larger: about 2¼ percentage points on average over the same period. The projected drag on the growth of potential output is about one-third of that for actual output.
- Introduction
- Commodity Terms-of-Trade Windfalls: A Model-Based Illustration
- Five Decades of Evidence: Commodity Terms-of-Trade Cycles and Output
- Sectoral Reallocation during Commodity Booms: Case Studies
- Conclusions
- References
| Annexes | |||
| 2.1 | Data Sources, Index Construction, and Country Grouping | ||
| 2.2 | Methodology for Dating Commodity Price Cycles | ||
| 2.3 | Stylized Facts and Event Studies | ||
| 2.4 | Local Projection Method | ||
| Boxes | |||
| 2.1 | The Not-So-Sick Patient: Commodity Booms and the Dutch Disease Phenomenon | ||
| 2.2 | Commodity Booms and Public Investment | ||
| 2.3 | Getting By with a Little Help from a Boom: Do Commodity Windfalls Speed Up Human Development? | ||
| 2.4 | Do Commodity Exporters’ Economies Overheat during Commodity Booms? | ||
| Tables | |||
| 2.1 | Commodity Exports | ||
| Annex 2.1.1 | Data Sources | ||
| Annex 2.1.2 | Commodity-Exporting Emerging Market and Developing Economies | ||
| Annex 2.4.1 | Sample of Commodity Exporters Used in the Local Projection Method Estimations, 1960–2007 | ||
| Annex 2.4.2 | Country Coverage for Key Macroeconomic Variables in the Local Projection Method Estimations | ||
| Figures | |||
| Chart | Data | 2.1 | World Commodity Prices, 1960–2015 |
| Chart | Data | 2.2 | Average Growth in Commodity-Exporting versus Other Emerging Market and Developing Economies, 1990–2015 |
| Chart | Data | 2.3 | Real Income, Output, and Domestic Demand, 2000–10 |
| Chart | Data | 2.4 | Model Simulations: Macroeconomic Effects of a Commodity Boom |
| Chart | Data | 2.5 | Consumption Dynamics with Overly Optimistic Commodity Price Expectations |
| Chart | Data | 2.6 | Sovereign Bond Yield Spreads and the Commodity Terms of Trade |
| Chart | Data | 2.7 | Identification of Cycles in the Commodity Terms of Trade: Three Country Examples |
| Chart | Data | 2.8 | Event Studies: Average Annual Growth Rates of Key Macroeconomic Variables during Commodity Terms-of-Trade Upswings and Downswings |
| Chart | Data | 2.9 | Variation in Average Output Growth between Upswings and Downswings: The Role of Policy Frameworks and Financial Depth |
| Chart | Data | 2.10 | Most Recent Upswing: Average Real Growth Rates during Upswings and Downswings |
| Chart | Data | 2.11 | Macroeconomic Variables in the Aftermath of Commodity Terms-of-Trade Shocks |
| Chart | Data | 2.12 | Output in the Aftermath of Commodity Terms-of-Trade Shocks: Role of Income Level and Type of Community |
| Chart | Data | 2.13 | Commodity Booms and Macroeconomic Indicators in Australia, Canada, and Chile |
| Chart | Data | 2.14 | Growth of Capital and Labor by Sector: Boom versus Preboom Periods |
| Chart | Data | 2.15 | Evolution of Activity in Nontradables Relative to Manufacturing, Commodity Importers Relative to Commodity Importers |
| Chart | Data | 2.16 | Total Factor Productivity Growth Decompositions |
| Chart | Data | 2.17 | Investment and Total Factor Productivity Growth |
| Chart | Data | Annex 2.2.1 |
Characteristics, Amplitudes, and Durations of Cycles |
| Chart | Data | Annex 2.3.1 |
Commodity Intensity, Policy Frameworks, and Financial Depth: Commodity-Exporting Emerging Markets Relative to Low-Income Developing Countries |
| Chart | Data | Annex 2.3.2 |
Average Differences in Real Growth Rates between Upswings and Downswings |
| Chart | Data | 2.1.1 | Manufacturing Export Performance |
| Chart | Data | 2.2.1 | Long-Term Effects of Heightened Public Investment during Commodity Booms |
| Chart | Data | 2.3.1 | Human Development Indicators |
| Chart | Data | 2.3.2 | Comparing the Performance of Commodity and Noncommodity Exporters |
| Chart | Data | 2.3.3 | Event Studies: Average Changes in Human Development Indicators during Upswings and Downswings |
| Chart | Data | 2.4.1 | Output Gaps in Six Commodity Exporters |
| Chart | Data | 2.4.2 | Changes in the Output Gap and Terms of Trade |
| Chart | Data | 2.4.3 | Real-Time and Multivariate-Filter Estimates of 2007 Output Gaps |
Chapter 3. Exchange Rates and Trade Flows: Disconnected?
Recent exchange rate movements have been unusually large, triggering a debate regarding their likely effects on trade. Historical experience in advanced and emerging market and developing economies suggests that exchange rate movements typically have sizable effects on export and import volumes. A 10 percent real effective depreciation in an economy’s currency is associated with a rise in real net exports of, on average, 1.5 percent of GDP, with substantial cross-country variation around this average. Although these effects fully materialize over a number of years, much of the adjustment occurs in the first year. The boost to exports associated with currency depreciation is found to be largest in countries with initial economic slack and with domestic financial systems that are operating normally. Some evidence suggests that the rise of global value chains has weakened the relationship between exchange rates and trade in intermediate products used as inputs into other economies’ exports. However, the bulk of global trade still consists of conventional trade, and there is little evidence of a general trend toward disconnect between exchange rates and total exports and imports.
- Introduction
- From Exchange Rates to Trade: Historical Evidence
- Disconnect or Stability?
- Implications for the Outlook
- References
| Annexes | |||
| 3.1 | Data | ||
| 3.2 | Estimation of Trade Elasticities | ||
| 3.3 | Derivation of the Marshall-Lerner Condition under Incomplete Pass-Through | ||
| 3.4 | Analysis of Large Exchange Rate Depreciation Episodes | ||
| 3.5 | Trade Elasticities over Time: Stability Tests | ||
| Boxes | |||
| 3.1 | The Relationship between Exchange Rates and Global-Value-Chain-Related Trade | ||
| 3.2 | Measuring Real Effective Exchange Rates and Competitiveness: The Role of Global Value Chains | ||
| 3.3 | Japanese Exports: What’s the Holdup? | ||
| Tables | |||
| 3.1 | Exchange Rate Pass-Through and Price Elasticities | ||
| Annex 3.1.1 |
Data Sources | ||
| Annex 3.1.2 |
Economies Included in Estimation of Trade Elasticities | ||
| Annex 3.1.3 |
Economies Covered in the Trade in Value Added Database | ||
| Annex 3.1.4 |
Economies Included in the Rolling Regressions | ||
| Annex 3.4.1 |
Large Exchange Rate Depreciations Not Associated with Banking Crises | ||
| Annex 3.4.2 |
Large Exchange Rate Depreciations Associated with Banking Crises | ||
| Annex 3.5.1 |
Trade Elasticities over Time: Stability Tests | ||
| 3.1.1 | Responses of Global-Value-Chain-Related Trade to the Real Effective Exchange Rate | ||
| Figures | |||
| Chart | Data | 3.1 | Recent Exchange Rate Movements in Historical Perspective |
| Chart | Data | 3.2 | Long-Term Exchange Rate Pass-Through and Price Elasticities |
| Chart | Data | 3.3 | Effect of a 10 Percent Real Effective Depreciation on Real Net Exports |
| Chart | Data | 3.4 | Export Dynamics Following Large Exchange Rate Depreciations |
| Chart | Data | 3.5 | Export Dynamics Following Large Exchange Rate Depreciations: The Role of Initial Economic Slack |
| Chart | Data | 3.6 | Export Dynamics Following Large Exchange Rate Depreciations Associated with Banking Crises |
| Chart | Data | 3.7 | Evolution of Global Value Chains |
| Chart | Data | 3.8 | Trade Elasticities over Time in Different Regions |
| Chart | Data | 3.9 | Ratios of Exports and Imports to GDP, 1990–2014 |
| Chart | Data | 3.10 | Export Dynamics Following Large Exchange Rate Depreciations: Through and After 1997 |
| Chart | Data | 3.11 | Illustrative Effect of Real Effective Exchange Rate Movements since January 2013 on Real Net Exports |
| Chart | Data | Annex 3.2.1 |
Exchange Rate Pass-Through Estimates: Comparison with Bussière, Delle Chiaie, and Peltonen 2014 |
| Chart | Data | Annex 3.2.2 |
Income Elasticities of Imports and Exports |
| Chart | Data | Annex 3.4.1 |
Export Dynamics Following Large Exchange Rate Depreciations |
| Chart | Data | Annex 3.4.2 |
Export Dynamics Following Large Exchange Rate Depreciations Identified Based on the Real Effective Exchange Rate |
| Chart | Data | Annex 3.4.3 |
Export Dynamics Following Laeven and Valencia 2013 Currency Crises |
| Chart | Data | Annex 3.4.4 |
Export Dynamics Following Large Exchange Rate Depreciations: Role of Initial Output Gap |
| Chart | Data | 3.1.1 | Decomposition of Gross Exports and Imports, 1995 versus 2011 |
| Chart | Data | 3.1.2 | Global Value Chain Trade Elasticities |
| Chart | Data | 3.2.1 | Real Effective Exchange Rate Weights Assigned to China and Germany |
| Chart | Data | 3.2.2 | Comparison of Conventional and Input-Output Real Effective Exchange Rates |
| Chart | Data | 3.3.1 | Japan: Exchange Rate and Exports |
| Chart | Data | 3.3.2 | Exchange Rate, Profits, and Pass-Through |
| Chart | Data | 3.3.3 | Offshoring and Exports |
Statistical Appendix
- Assumptions
- What's New
- Data and Conventions
- Classification of Countries
- General Features and Composition of Groups in the World Economic Outlook Classification
- Table A. Classification by World Economic Outlook Groups and Their Shares in Aggregate GDP, Exports of Goods and Services, and Population, 2014
- Table B. Advanced Economies by Subgroup
- Table C. European Union
- Table D. Emerging Market and Developing Economies by Region and Main Source of Export Earnings
- Table E. Emerging Market and Developing Economies by Region, Net External Position, and Status as Heavily Indebted Poor Countries and Low-Income Developing Countries
- Table F. Economies with Exceptional Reporting Periods
- Table G. Key Data Documentation
- Box A1. Economic Policy Assumptions Underlying the Projections for Selected Economies
| List of Tables Part A (Download PDF) | |||
| A1. | Summary of World Output | ||
| A2. | Advanced Economies: Real GDP and Total Domestic Demand | ||
| A3. | Advanced Economies: Components of Real GDP | ||
| A4. | Emerging Market and Developing Economies: Real GDP | ||
| A5. | Summary of Inflation | ||
| A6. | Advanced Economies: Consumer Prices | ||
| A7. | Emerging Market and Developing Economies: Consumer Prices | ||
| A8. | Major Advanced Economies: General Government Fiscal Balances and Debt | ||
| A9. | Summary of World Trade Volumes and Prices | ||
| A10. | Summary of Current Account Balances | ||
| A11. | Advanced Economies: Balance on Current Account | ||
| A12. | Emerging Market and Developing Economies: Balance on Current Account | ||
| A13. | Summary of Financial Account Balances | ||
| A14. | Summary of Net Lending and Borrowing | ||
| A15. | Summary of World Medium-Term Baseline Scenario | ||
| List of Tables Part B (Download PDF - available on the web only) | |||
| B1. | Advanced Economies: Unemployment, Employment, and Real GDP per Capita | ||
| B2. | Emerging Market and Developing Economies: Real GDP | ||
| B3. | Advanced Economies: Hourly Earnings, Productivity, and Unit Labor Costs in Manufacturing | ||
| B4. | Emerging Market and Developing Economies: Consumer Prices | ||
| B5. | Summary of Fiscal and Financial Indicators | ||
| B6. | Advanced Economies: General and Central Government Net Lending/Borrowing Excluding Social Security Schemes | ||
| B7. | Advanced Economies: General Government Structural Balances | ||
| B8. | Emerging Market and Developing Economies: General Government Net Lending/Borrowing and Overall Fiscal Balance | ||
| B9. | Emerging Market and Developing Economies: General Government Net Lending/Borrowing | ||
| B10. | Selected Advanced Economies: Exchange Rates | ||
| B11. | Emerging Market and Developing Economies: Broad Money Aggregates | ||
| B12. | Advanced Economies: Export Volumes, Import Volumes, and Terms of Trade in Goods and Services | ||
| B13. | Emerging Market and Developing Economies by Region: Total Trade in Goods | ||
| B14. | Emerging Market and Developing Economies by Source of Export Earnings: Total Trade in Goods | ||
| B15. | Summary of Current Account Transactions | ||
| B16. | Emerging Market and Developing Economies: Summary of External Debt and Debt Service | ||
| B17. | Emerging Market and Developing Economies by Region: External Debt by Maturity | ||
| B18. | Emerging Market and Developing Economies by Analytical Criteria: External Debt by Maturity | ||
| B19. | Emerging Market and Developing Economies: Ratio of External Debt to GDP | ||
| B20. | Emerging Market and Developing Economies: Debt-Service Ratios | ||
| B21. | Emerging Market and Developing Economies, Medium-Term Baseline Scenario: Selected Economic Indicators | ||
| World Economic Outlook, Selected Topics | |||
| IMF Executive Board Discussion of the Outlook, October 2015
|
|||