The global financial crisis of 2008–09 came amid the collapse of a housing bubble that few saw coming. Today, housing bubbles remain poorly understood, even though they have drawn increased attention for their effects on financial stability and monetary policy transmission. But with real-time monitoring tools policymakers can help mitigate unsustainable booms.
This starts with better methods for identifying asset price bubbles. Standard asset pricing models show that prices are influenced by current returns and expected resale values in the future. A bubble occurs when an asset’s price exceeds its intrinsic value, driven by expectations of continued appreciation. The housing market, characterized by stubbornly inelastic supply, exemplifies this dynamic, often fueled by fear of missing out or speculative behavior.
Earlier detection methods relied on modeling intrinsic value, which often proved inadequate because it’s difficult to know true intrinsic values. This leads to biased estimates and delayed recognition of bubbles—as seen in the global financial crisis.
Recent advances in time series and panel techniques—designed to analyze data over time and across groups or locations—make it possible to detect bubbles in real time by focusing on statistical patterns that indicate bubbles, without the need to model intrinsic value.
Among these patterns is explosive price growth—or “exuberance,” as we call it. This approach identifies bubbles based on observable symptoms, akin to using blood pressure as an early warning health indicator.
The exuberance detection methodology, pioneered by Peter Phillips and coauthors, is the cornerstone of the Dallas Federal Reserve Bank’s International House Price Database, which has quarterly data on house prices and disposable incomes for 26 countries stretching back to 1975 (Mack, Martínez García, and Grossman 2019). The database supports the monitoring work of the International Housing Observatory.
These two initiatives, which have benefited from further advances in detection methods (Phillips, Shi, and Yu 2015; Pavlidis and others 2016), aim to increase awareness of housing bubbles and provide user-friendly codes to manage financial stability risks in real time.
Measures of exuberance
Detecting bubbles in housing markets starts with close monitoring of real house prices, since exuberance in nominal house prices may arise from an upsurge in inflation rather than a bubble. Expressing house prices in real terms prevents any confusion that may occur during periods of hyperinflation, as in the cases of Croatia, Israel, and Slovenia in the late 20th century.
Housing affordability—how prices align with buyers’ purchasing power—is just as significant. Lenders often reference the debt-to-income ratio, which measures the share of disposable income allocated to debt payments. A reliable proxy for this measure (assuming stable loan-to-value ratios) is the price-to-income ratio.
As the price-to-income ratio rises, financing becomes harder to obtain, reducing demand and pushing down prices. The price-to-income ratio is crucial for distinguishing expectations-driven bubbles from other market dynamics, as exuberance in this ratio signals the severity of a nonfundamental bubble more reliably than real house price exuberance alone.
Chart 1 compares exuberance episodes in real house prices and price-to-income ratios. It reveals three important insights.
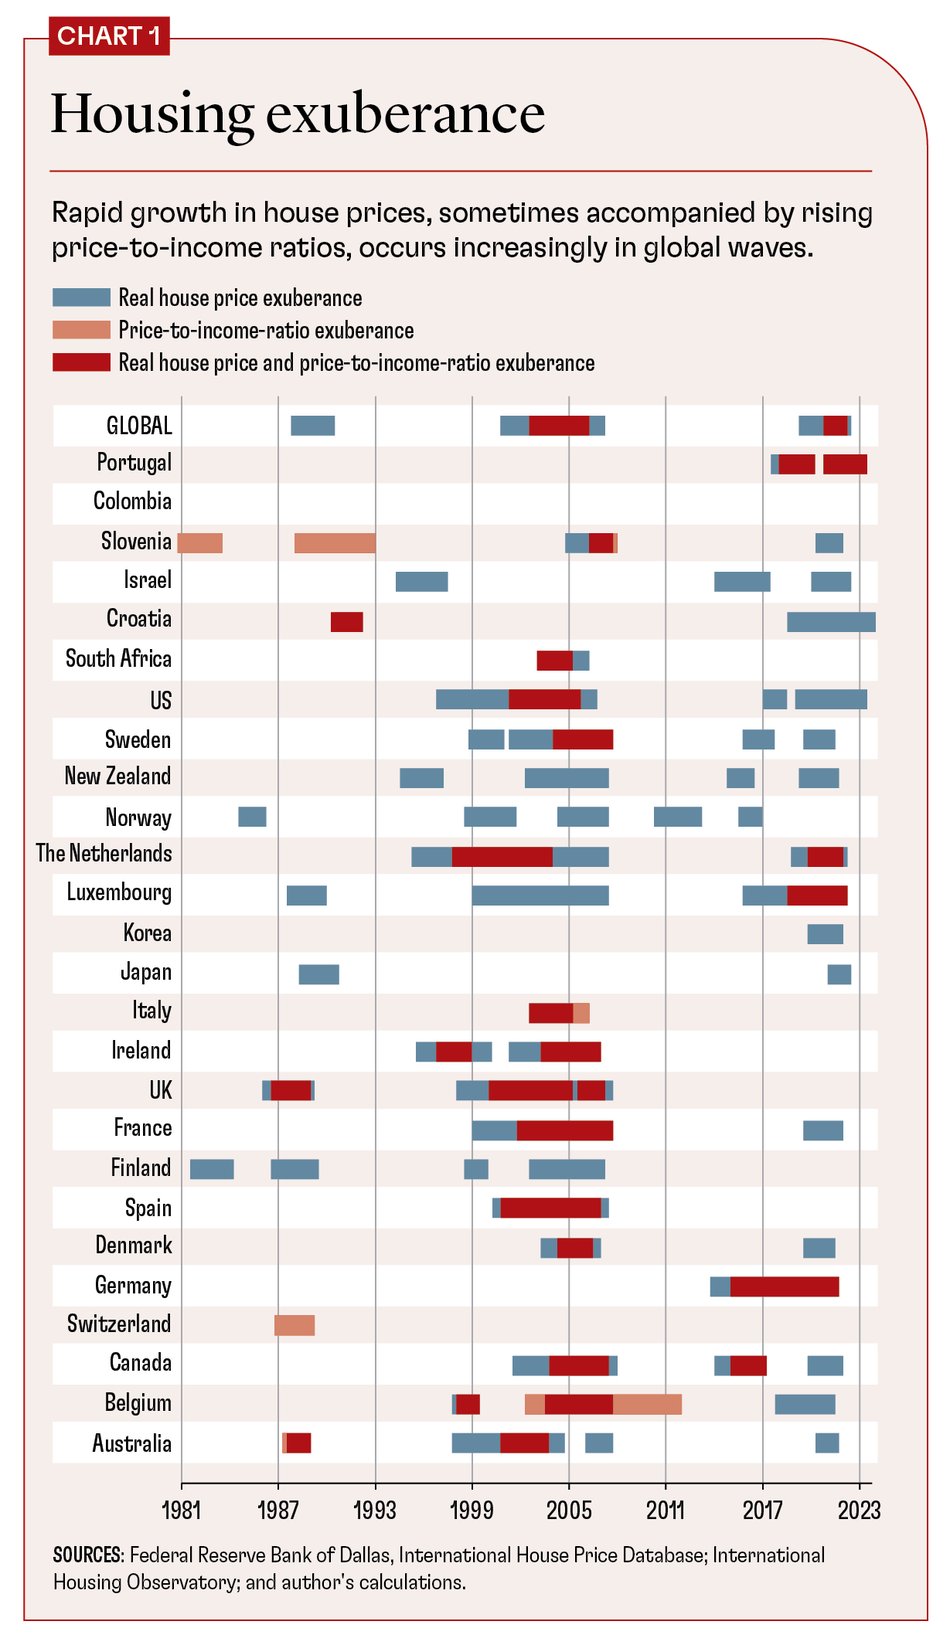
First, housing exuberance has become more widespread and synchronous in the post–Bretton Woods era of flexible exchange rates and open capital accounts. It also shows a global wave of real house price exuberance ahead of, and accelerated by, the pandemic. But thanks to stricter lending standards and prudential regulations, exuberance in the price-to-income ratio was limited to just four countries—Portugal, The Netherlands, Luxembourg, and Germany.
This contrasts with widespread bubbles that formed before the global financial crisis and affected price-to-income ratios more widely. Although the pandemic-induced housing boom was intense, it was short-lived: macroprudential policies curbed credit, deflated the bubble early, and preserved banking and financial stability.
Second, credit growth and stock market volatility are key drivers of housing exuberance. Rapid credit expansion fuels speculative leveraged buying, pushing house prices beyond fundamentals. This credit-driven exuberance can unravel quickly if conditions deteriorate or borrowing tightens.
Similarly, stock market volatility prompts investors to seek perceived safer or higher returns in real estate, inflating prices further. In uncertain times, housing often serves as a hedge, attracting investors and driving prices up even without fundamental support.
International capital flows synchronize housing cycles, spreading exuberance and increasing vulnerability to simultaneous housing downturns, as Efthymios Pavlidis, Valerie Grossman, and I highlighted in a 2019 paper. Understanding these drivers helps identify patterns of cross-country contagion and global housing boom-bust cycles.
Third, financial spillovers from other asset classes, such as real stock market growth, and a steepening yield curve (the spread between long- and short-term rates) also increase the likelihood of housing exuberance, which often persists once triggered. During a stock market boom or when the yield curve steepens under expansionary conditions, investors may flock to housing, reallocating their portfolios in search of yield and driving up prices, Grossman and I noted in a 2020 article.
This self-reinforcing behavior, where rising prices seem to validate the expectations of higher returns that attracted investors in the first place, sustains bubbles—sometimes for long periods. It underscores the importance of monitoring yield curve shifts and emerging bubbles in other asset classes to detect financial contagion.
Pandemic lessons
The house-price-to-rent ratio, similar to the price-to-earnings ratio for stocks, reflects how much investors are willing to pay for each dollar of rent generated by a property. When house prices significantly exceed rents—often exacerbated by slow rent adjustments because of fixed contracts—buyers may opt to rent instead, potentially reducing demand to buy and prompting a price correction.
This ratio serves as a long-term anchor for housing market profitability. But, if it continues to rise at an explosive pace, it may indicate that house prices are being driven by speculative expectations rather than underlying fundamentals.