

Loading component...
World Economic Outlook
Subdued Demand:Symptoms and Remedies
October 2016
IMF Chief Economist Maurice Obstfeld explains the outlook for the global economy

The World Economic Outlook (WEO) presents IMF economists' analyses of global economic developments, issues affecting advanced, emerging, and developing economies, and topics of current interest.
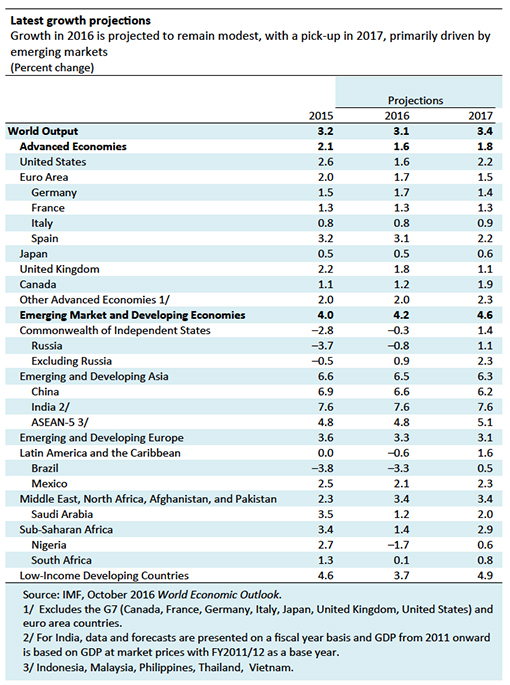
Global growth is projected to slow to 3.1 percent in 2016 before recovering to 3.4 percent in 2017. The forecast, revised down by 0.1 percentage point for 2016 and 2017 relative to April, reflects a more subdued outlook for advanced economies following the June U.K. vote in favor of leaving the European Union (Brexit) and weaker-than-expected growth in the United States. These developments have put further downward pressure on global interest rates, as monetary policy is now expected to remain accommodative for longer.
| Figures | |||
|---|---|---|---|
| Chart | Data | 1.1 | Global Activity Indicators |
| Chart | Data | 1.2 | Global Inflation |
| Chart | Data | 1.3 | Commodity and Oil Markets |
| Chart | Data | 1.4 | Real Effective Exchange Rate Changes, March 2016–September 2016 |
| Chart | Data | 1.5 | Emerging Market Economies: Capital Flows |
| Chart | Data | 1.6 | Advanced Economies: Monetary and Financial Market Conditions |
| Chart | Data | 1.7 | Advanced Economies: Credit, House Prices, and Balance Sheets |
| Chart | Data | 1.8 | Emerging Market Economies: Interest Rates |
| Chart | Data | 1.9 | Emerging Market Economies: Equity Markets and Credit |
| Chart | Data | 1.10 | Domestic Demand, Output Gap, Unemployment, and Labor Force Participation in Advanced Economies |
| Chart | Data | 1.11 | Demographics |
| Chart | Data | 1.12 | Advanced Economies: Growth, Investment, and Employment in Recent WEO Vintages |
| Chart | Data | 1.13 | Emerging Markets: Terms-of-Trade Windfall Gains and Losses and Real Exchange Rates |
| Chart | Data | 1.14 | Real per Capita Growth Rates and Convergence (1995–2020) |
| Chart | Data | 1.15 | Fiscal Indicators |
| Chart | Data | 1.16 | External Sector |
| Chart | Data | 1.17 | Creditors versus Debtors |
| Chart | Data | 1.18 | Current Account Gaps and Real Exchange Rates |
| Chart | Data | 1.19 | Risks to the Global Outlook |
| Chart | Data | 1.20 | Recession and Deflation Risks |
| Chart | Data | Scen.Fig.1 | Unilateral and Bilateral Imposition of Tariffs on Imported Goods |
| Chart | Data | Scen.Fig.2 | A Worldwide Increase in Protectionism |
| Chart | Data | 1.1.1 | World Growth Projections over the Medium Term |
| Chart | Data | 1.SF.1 | Commodity Market Developments |
| Chart | Data | 1.SF.2 | Producer Support Estimate |
| Chart | Data | 1.SF.3 | World Food Production and Consumption by Country, 2015 |
| Chart | Data | 1.SF.4 | Population and World Food Consumption |
| Chart | Data | 1.SF.5 | Maize Yield |
| Chart | Data | 1.SF.6 | Food Prices and Violent Events |
| Chart | Data | 1.SF.7 | Global Food Security Index, 2016 |
| Chart | Data | 1.SF.1.1 | Evolution of Deals over Time by Target Region |
The forces shaping the global outlook—both those operating over the short and long term—point to subdued growth for 2016 and a gradual recovery thereafter but also to downside risks. These forces include new shocks, such as Brexit; ongoing realignments in China and among commodity exporters; slow-moving trends in demographics and productivity growth, as well as noneconomic factors, such as geopolitical uncertainties.
| Tables |
|---|
| Figures | |||
|---|---|---|---|
| Chart | Data | 1.1 | Global Activity Indicators |
| Chart | Data | 1.2 | Global Inflation |
| Chart | Data | 1.3 | Commodity and Oil Markets |
| Chart | Data | 1.4 | Real Effective Exchange Rate Changes, March 2016–September 2016 |
| Chart | Data | 1.5 | Emerging Market Economies: Capital Flows |
| Chart | Data | 1.6 | Advanced Economies: Monetary and Financial Market Conditions |
| Chart | Data | 1.7 | Advanced Economies: Credit, House Prices, and Balance Sheets |
| Chart | Data | 1.8 | Emerging Market Economies: Interest Rates |
| Chart | Data | 1.9 | Emerging Market Economies: Equity Markets and Credit |
| Chart | Data | 1.10 | Domestic Demand, Output Gap, Unemployment, and Labor Force Participation in Advanced Economies |
| Chart | Data | 1.11 | Demographics |
| Chart | Data | 1.12 | Advanced Economies: Growth, Investment, and Employment in Recent WEO Vintages |
| Chart | Data | 1.13 | Emerging Markets: Terms-of-Trade Windfall Gains and Losses and Real Exchange Rates |
| Chart | Data | 1.14 | Real per Capita Growth Rates and Convergence (1995–2020) |
| Chart | Data | 1.15 | Fiscal Indicators |
| Chart | Data | 1.16 | External Sector |
| Chart | Data | 1.17 | Creditors versus Debtors |
| Chart | Data | 1.18 | Current Account Gaps and Real Exchange Rates |
| Chart | Data | 1.19 | Risks to the Global Outlook |
| Chart | Data | 1.20 | Recession and Deflation Risks |
| Chart | Data | Scen.Fig.1 | Unilateral and Bilateral Imposition of Tariffs on Imported Goods |
| Chart | Data | Scen.Fig.2 | A Worldwide Increase in Protectionism |
| Chart | Data | 1.1.1 | World Growth Projections over the Medium Term |
| Chart | Data | 1.SF.1 | Commodity Market Developments |
| Chart | Data | 1.SF.2 | Producer Support Estimate |
| Chart | Data | 1.SF.3 | World Food Production and Consumption by Country, 2015 |
| Chart | Data | 1.SF.4 | Population and World Food Consumption |
| Chart | Data | 1.SF.5 | Maize Yield |
| Chart | Data | 1.SF.6 | Food Prices and Violent Events |
| Chart | Data | 1.SF.7 | Global Food Security Index, 2016 |
| Chart | Data | 1.SF.1.1 | Evolution of Deals over Time by Target Region |
| Figures | |||
|---|---|---|---|
| Chart | Data | 2.1 | World Real Trade and GDP Growth in Historical Perspective |
| Chart | Data | 2.2 | World Trade in Volumes, Values, and across Countries |
| Chart | Data | 2.3 | Trade Dynamics across Broad Country Groups |
| Chart | Data | 2.4 | Trade Dynamics across Types of Trade and Products |
| Chart | Data | 2.5 | Empirical Model: Actual and Predicted Evolution of Real Import Growth |
| Chart | Data | 2.6 | Empirical Model: Difference Between Actual and Predicted Growth of Real Goods Imports |
| Chart | Data | 2.7 | Empirical Model: Decomposing the Slowdown in Real Goods Import Growth |
| Chart | Data | 2.8 | Structural Model: Actual and Model-Implied Evolution of Nominal Import-to-GDP Ratio |
| Chart | Data | 2.9 | Trade Costs in Historical Perspective: A Top-Down Approach |
| Chart | Data | 2.10 | Trade Policies in Historical Perspective |
| Chart | Data | 2.11 | Logistics and Transportation Costs of Trade in Historical Perspective |
| Chart | Data | 2.12 | Global Value Chains in Historical Perspective |
| Chart | Data | 2.13 | Contribution of Trade Policies and Global Value Chains to the Slowdown in Real Goods Import Growth |
| Chart | Data | 2.14 | Gravity Model: Global Value Chain Participation and Bilateral Sectoral Trade Growth |
| Chart | Data | Annex 2.1.1 |
Nominal Import Growth across Categories of Services |
| Chart | Data | Annex 2.2.1 |
Real Import Growth |
| Chart | Data | Annex 2.5.1 |
Trade Finance Availability |
| Chart | Data | Annex 2.5.2 |
Contribution of Trade Policies and Global Value Chains to the Slowdown in Real and Nominal Goods Import Growth |
| Chart | Data | 2.1.1 | The Evolution of Trade across Industries in Major Economies |
| Chart | Data | 2.2.1 | Potential Gains from Tackling Traditional Trade Barriers |
| Chart | Data | 2.2.2 | Trade Policy Frontier Areas |
| Chart | Data | 2.3.1 | Gains from Eliminating Tariffs and Implementing the World Trade Organization Trade Facilitation Agreement |
Trade growth has slowed since 2012 relative both to its strong historical performance and to overall economic growth. This chapter finds that the overall weakness in economic activity, in particular in investment, has been the primary restraint on trade growth, accounting for up to three-fourths of the slowdown. However, other factors are also weighing on trade. The waning pace of trade liberalization and the recent uptick in protection-ism are holding back trade growth, even though their quantitative impact thus far has been limited. The decline in the growth of global value chains has also played an important part in the observed slowdown. The findings suggest that addressing the general weak-ness in economic activity, especially in investment, will stimulate trade, which in turn could help strengthen productivity and growth. In addition, given the subdued global growth outlook, further trade reforms that lower barriers, coupled with measures to mitigate the cost to those who shoulder the burden of adjustment, would boost the international exchange of goods and services and revive the virtuous cycle of trade and growth.
| Tables |
|---|
| Figures | |||
|---|---|---|---|
| Chart | Data | 2.1 | World Real Trade and GDP Growth in Historical Perspective |
| Chart | Data | 2.2 | World Trade in Volumes, Values, and across Countries |
| Chart | Data | 2.3 | Trade Dynamics across Broad Country Groups |
| Chart | Data | 2.4 | Trade Dynamics across Types of Trade and Products |
| Chart | Data | 2.5 | Empirical Model: Actual and Predicted Evolution of Real Import Growth |
| Chart | Data | 2.6 | Empirical Model: Difference Between Actual and Predicted Growth of Real Goods Imports |
| Chart | Data | 2.7 | Empirical Model: Decomposing the Slowdown in Real Goods Import Growth |
| Chart | Data | 2.8 | Structural Model: Actual and Model-Implied Evolution of Nominal Import-to-GDP Ratio |
| Chart | Data | 2.9 | Trade Costs in Historical Perspective: A Top-Down Approach |
| Chart | Data | 2.10 | Trade Policies in Historical Perspective |
| Chart | Data | 2.11 | Logistics and Transportation Costs of Trade in Historical Perspective |
| Chart | Data | 2.12 | Global Value Chains in Historical Perspective |
| Chart | Data | 2.13 | Contribution of Trade Policies and Global Value Chains to the Slowdown in Real Goods Import Growth |
| Chart | Data | 2.14 | Gravity Model: Global Value Chain Participation and Bilateral Sectoral Trade Growth |
| Chart | Data | Annex 2.1.1 |
Nominal Import Growth across Categories of Services |
| Chart | Data | Annex 2.2.1 |
Real Import Growth |
| Chart | Data | Annex 2.5.1 |
Trade Finance Availability |
| Chart | Data | Annex 2.5.2 |
Contribution of Trade Policies and Global Value Chains to the Slowdown in Real and Nominal Goods Import Growth |
| Chart | Data | 2.1.1 | The Evolution of Trade across Industries in Major Economies |
| Chart | Data | 2.2.1 | Potential Gains from Tackling Traditional Trade Barriers |
| Chart | Data | 2.2.2 | Trade Policy Frontier Areas |
| Chart | Data | 2.3.1 | Gains from Eliminating Tariffs and Implementing the World Trade Organization Trade Facilitation Agreement |
| Figures | |||
|---|---|---|---|
| Chart | Data | 3.1 | Oil Prices and Consumer Price Inflation |
| Chart | Data | 3.2 | Share of Countries with Low Inflation |
| Chart | Data | 3.3 | Medium-Term Inflation Expectations and Oil Prices |
| Chart | Data | 3.4 | Effect of Disinflationary Shocks in Advanced Economies under Constrained Monetary Policy and Unanchored Inflation Expectations |
| Chart | Data | 3.5 | Consumer Price Inflation |
| Chart | Data | 3.6 | Share of Consumer Price Inflation Variation Explained by First Common Factor |
| Chart | Data | 3.7 | Core Consumer Price Inflation |
| Chart | Data | 3.8 | Wage Inflation in Advanced Economies |
| Chart | Data | 3.9 | Sectoral Producer Prices in Advanced Economies |
| Chart | Data | 3.10 | Sectoral Consumer Prices in Advanced Economies |
| Chart | Data | 3.11 | Estimated Phillips Curve Parameters |
| Chart | Data | 3.12 | Contribution to Inflation Deviations from Targets: Advanced Economies |
| Chart | Data | 3.13 | Contribution to Inflation Deviations from Targets: Emerging Market Economies |
| Chart | Data | 3.14 | Correlation of Manufacturing Slack in China, Japan, and the United States with Import Price Contribution to Inflation in Other Economies |
| Chart | Data | 3.15 | Survey- and Market-Based Inflation Expectations |
| Chart | Data | 3.16 | Sensitivity of Inflation Expectations to Inflation Surprises |
| Chart | Data | 3.17 | Sensitivity of Inflation Expectations to Inflation Surprises and Monetary Policy Frameworks |
| Chart | Data | 3.18 | Sensitivity of Inflation Expectations to Inflation Surprises before and after Adoption of Inflation Targeting |
| Chart | Data | 3.19 | Sensitivity of Inflation Expectations to Inflation Surprises over Time |
| Chart | Data | 3.20 | Change in Sensitivity of Inflation Expectations to Inflation Surprises |
| Chart | Data | 3.21 | Average Sensitivity of Inflation Expectations to Inflation Surprises in Countries at the Effective Lower Bound |
| Chart | Data | 3.22 | Sensitivity of Longer-Term Inflation Expectations to Changes in Oil Prices |
| Chart | Data | Annex 3.2.1 |
Effect of Disinflationary Shocks on Core Inflation in Advanced Economies under Constrained Monetary Policy |
| Chart | Data | Annex 3.2.2 |
Effect of Disinflationary Shocks on Core Inflation in Advanced Economies under Constrained Monetary Policy and Unanchored Inflation Expectations |
| Chart | Data | Annex 3.3.1 |
Share of Consumer Price Inflation Variation Explained by Different Factors |
| Chart | Data | Annex 3.3.2 |
First Common Factor and Commodity Prices |
| Chart | Data | Annex 3.4.1 |
Contribution to Inflation Deviations from Targets Using Various Measures of Inflation Expectations |
| Chart | Data | Annex 3.4.2 |
Contribution to Inflation Deviations from Targets Using Various Measures of Cyclical Unemployment |
| Chart | Data | Annex 3.4.3 |
Correlation of Manufacturing Slack in China, Japan, and the United States with Import Price Contribution to Inflation in Other Economies |
| Chart | Data | 3.4.4 | Correlation of China Manufacturing Slack with Import Price Contribution to Inflation in Other Economies—Results from Panel Regressions |
| Chart | Data | Annex 3.5.1 |
Change in Inflation Expectations and Inflation Shocks |
| Chart | Data | Annex 3.5.2 |
Sensitivity of Inflation Expectations when Controlling for Slack: Advanced Economies |
| Chart | Data | 3.1.1 | Producer Price and Consumer Price Inflation in China, Japan, and the United States |
| Chart | Data | 3.1.2 | Industrial Slack in China, Japan, and the United States |
| Chart | Data | 3.1.3 | Decomposition for Total Producer Price Inflation for China, Japan, and the United States |
| Chart | Data | 3.2.1 | Inflation Dynamics |
| Chart | Data | 3.2.2 | Cyclical and Structural Indicators in Japan |
| Chart | Data | 3.2.3 | Policy Indicators in Japan |
| Chart | Data | 3.3.1 | Food Weights in Consumption and Per Capita GDP |
| Chart | Data | 3.3.2 | World Food Prices and Consumer Food Prices |
| Chart | Data | 3.3.3 | Food Prices Relative to Nonfood Prices |
| Chart | Data | 3.3.4 | Food Pass-Through Coefficients for Various Country Groups |
| Chart | Data | 3.3.5 | Distribution of Food Pass-Through Coefficients |
| Chart | Data | 3.4.1 | Commodity Prices and Producer Prices |
| Chart | Data | 3.4.2 | Contribution to Cumulative Producer Price Inflation |
| Chart | Data | 3.5.1 | Forecast as Envisaged at 2009:Q2: Loss-Minimization versus Linear Reaction Function |
Inflation has declined markedly in many economies over the past few years. This chapter finds that disinflation is broad based across countries, measures, and sectors—albeit larger for tradable goods than for services. The main drivers of recent disinflation are persistent economic slack and softening commodity prices. Most of the available measures of medium-term inflation expectations have not declined substantially so far. However, the sensitivity of expectations to inflation surprises—an indicator of the degree of anchoring of inflation expectations—has increased in countries where policy rates have approached their effective lower bounds. While the magnitude of this change in sensitivity is modest, it does suggest that the perceived ability of monetary policy to combat persistent disinflation may be diminishing in these economies.
| Tables |
|---|
| Figures | |||
|---|---|---|---|
| Chart | Data | 3.1 | Oil Prices and Consumer Price Inflation |
| Chart | Data | 3.2 | Share of Countries with Low Inflation |
| Chart | Data | 3.3 | Medium-Term Inflation Expectations and Oil Prices |
| Chart | Data | 3.4 | Effect of Disinflationary Shocks in Advanced Economies under Constrained Monetary Policy and Unanchored Inflation Expectations |
| Chart | Data | 3.5 | Consumer Price Inflation |
| Chart | Data | 3.6 | Share of Consumer Price Inflation Variation Explained by First Common Factor |
| Chart | Data | 3.7 | Core Consumer Price Inflation |
| Chart | Data | 3.8 | Wage Inflation in Advanced Economies |
| Chart | Data | 3.9 | Sectoral Producer Prices in Advanced Economies |
| Chart | Data | 3.10 | Sectoral Consumer Prices in Advanced Economies |
| Chart | Data | 3.11 | Estimated Phillips Curve Parameters |
| Chart | Data | 3.12 | Contribution to Inflation Deviations from Targets: Advanced Economies |
| Chart | Data | 3.13 | Contribution to Inflation Deviations from Targets: Emerging Market Economies |
| Chart | Data | 3.14 | Correlation of Manufacturing Slack in China, Japan, and the United States with Import Price Contribution to Inflation in Other Economies |
| Chart | Data | 3.15 | Survey- and Market-Based Inflation Expectations |
| Chart | Data | 3.16 | Sensitivity of Inflation Expectations to Inflation Surprises |
| Chart | Data | 3.17 | Sensitivity of Inflation Expectations to Inflation Surprises and Monetary Policy Frameworks |
| Chart | Data | 3.18 | Sensitivity of Inflation Expectations to Inflation Surprises before and after Adoption of Inflation Targeting |
| Chart | Data | 3.19 | Sensitivity of Inflation Expectations to Inflation Surprises over Time |
| Chart | Data | 3.20 | Change in Sensitivity of Inflation Expectations to Inflation Surprises |
| Chart | Data | 3.21 | Average Sensitivity of Inflation Expectations to Inflation Surprises in Countries at the Effective Lower Bound |
| Chart | Data | 3.22 | Sensitivity of Longer-Term Inflation Expectations to Changes in Oil Prices |
| Chart | Data | Annex 3.2.1 |
Effect of Disinflationary Shocks on Core Inflation in Advanced Economies under Constrained Monetary Policy |
| Chart | Data | Annex 3.2.2 |
Effect of Disinflationary Shocks on Core Inflation in Advanced Economies under Constrained Monetary Policy and Unanchored Inflation Expectations |
| Chart | Data | Annex 3.3.1 |
Share of Consumer Price Inflation Variation Explained by Different Factors |
| Chart | Data | Annex 3.3.2 |
First Common Factor and Commodity Prices |
| Chart | Data | Annex 3.4.1 |
Contribution to Inflation Deviations from Targets Using Various Measures of Inflation Expectations |
| Chart | Data | Annex 3.4.2 |
Contribution to Inflation Deviations from Targets Using Various Measures of Cyclical Unemployment |
| Chart | Data | Annex 3.4.3 |
Correlation of Manufacturing Slack in China, Japan, and the United States with Import Price Contribution to Inflation in Other Economies |
| Chart | Data | 3.4.4 | Correlation of China Manufacturing Slack with Import Price Contribution to Inflation in Other Economies—Results from Panel Regressions |
| Chart | Data | Annex 3.5.1 |
Change in Inflation Expectations and Inflation Shocks |
| Chart | Data | Annex 3.5.2 |
Sensitivity of Inflation Expectations when Controlling for Slack: Advanced Economies |
| Chart | Data | 3.1.1 | Producer Price and Consumer Price Inflation in China, Japan, and the United States |
| Chart | Data | 3.1.2 | Industrial Slack in China, Japan, and the United States |
| Chart | Data | 3.1.3 | Decomposition for Total Producer Price Inflation for China, Japan, and the United States |
| Chart | Data | 3.2.1 | Inflation Dynamics |
| Chart | Data | 3.2.2 | Cyclical and Structural Indicators in Japan |
| Chart | Data | 3.2.3 | Policy Indicators in Japan |
| Chart | Data | 3.3.1 | Food Weights in Consumption and Per Capita GDP |
| Chart | Data | 3.3.2 | World Food Prices and Consumer Food Prices |
| Chart | Data | 3.3.3 | Food Prices Relative to Nonfood Prices |
| Chart | Data | 3.3.4 | Food Pass-Through Coefficients for Various Country Groups |
| Chart | Data | 3.3.5 | Distribution of Food Pass-Through Coefficients |
| Chart | Data | 3.4.1 | Commodity Prices and Producer Prices |
| Chart | Data | 3.4.2 | Contribution to Cumulative Producer Price Inflation |
| Chart | Data | 3.5.1 | Forecast as Envisaged at 2009:Q2: Loss-Minimization versus Linear Reaction Function |
| Figures | |||
|---|---|---|---|
| Chart | Data | 4.1 | China: GDP and Trade Growth |
| Chart | Data | 4.2 | Number of International Migrants and Refugees |
| Chart | Data | 4.3 | China: Global Clout and Rebalancing |
| Chart | Data | 4.4 | Spillovers from China over Time |
| Chart | Data | 4.5 | Impact on Exports of a 1-Percent Shock to China’s Demand after One Year |
| Chart | Data | 4.6 | Decline in Average Export Growth Rate Attributed to China Demand, 2014:Q1–2015:Q3 |
| Chart | Data | 4.7 | China: Processing Trade |
| Chart | Data | 4.8 | A Large Footprint in Commodity Markets |
| Chart | Data | 4.9 | Cumulative One-Year Price Impact from a 1 Percent Shock to China’s Industrial Production |
| Chart | Data | 4.10 | China: Slowdown Scenario |
| Chart | Data | 4.11 | Spillovers from China |
| Chart | Data | 4.12 | Transmission of Spillovers through Financial Channels |
| Chart | Data | 4.13 | China: Cyclical Slowdown Scenario |
| Chart | Data | 4.14 | International Migrants and Refugees |
| Chart | Data | 4.15 | Migration by Age and Skill |
| Chart | Data | 4.16 | Determinants of Migration |
| Chart | Data | 4.17 | Females: Low Education versus High Skilled, 2000 |
| Chart | Data | 4.18 | Labor Market Performance |
| Chart | Data | 4.19 | Germany: Present Value of Expected Future Net Fiscal Contribution by Age Group |
| Chart | Data | 4.20 | Estimated Impact of Migration in More Developed Economies, 2100 |
| Chart | Data | 4.21 | Migration: Positive Longer-Term Growth Effects |
| Chart | Data | 4.22 | Contributions of Outward Migration to Population Growth |
| Chart | Data | 4.23 | Migration of Population with Tertiary Education |
| Chart | Data | 4.24 | Remittances and Diasporas |
| Chart | Data | 4.1.1 | China’s Ties with Low-Income and Developing Countries |
| Chart | Data | 4.3.1 | Migration in Sub-Saharan Africa |
| Chart | Data | 4.3.2 | Age and Education of Migrants and Origin Country Population |
| Chart | Data | 4.3.3 | Top Receivers of Remittances in Sub-Saharan Africa, 2013–15 |
Spillovers are a key factor shaping the global outlook and the risks around it, and the growing clout of emerging markets means that they are playing an increasing role, including from noneconomic shocks. This chapter analyzes spillovers of: (i) China’s rebalancing towards more sustainable growth, and (ii) increasing migration flows. China’s transition has a direct negative impact on global demand through trade, an indirect impact through commodity prices, and an effect on asset prices. However, a well-managed transition will benefit the global economy in the long term, with more sustainable growth in China and a reduction of risks of a disruptive adjustment. China can help by accepting the slowdown and by clearly communicating its policy intentions. Countries experiencing negative spillovers can use policy buffers in the short term, but plan for adjustment and explore new opportunities to bolster trade. As for migration, it can provoke political backlash in recipient economies, but offers gains in terms of higher growth and relief from population aging. Labor market integration is key to harnessing the gains in terms of growth and migrants’ contributions to the fiscal accounts. Source countries may face negative growth effects, which can be mitigated by remittances, the benefits of diaspora networks, and policies addressing the effects of emigration of young and skilled population.
| Figures | |||
|---|---|---|---|
| Chart | Data | 4.1 | China: GDP and Trade Growth |
| Chart | Data | 4.2 | Number of International Migrants and Refugees |
| Chart | Data | 4.3 | China: Global Clout and Rebalancing |
| Chart | Data | 4.4 | Spillovers from China over Time |
| Chart | Data | 4.5 | Impact on Exports of a 1-Percent Shock to China’s Demand after One Year |
| Chart | Data | 4.6 | Decline in Average Export Growth Rate Attributed to China Demand, 2014:Q1–2015:Q3 |
| Chart | Data | 4.7 | China: Processing Trade |
| Chart | Data | 4.8 | A Large Footprint in Commodity Markets |
| Chart | Data | 4.9 | Cumulative One-Year Price Impact from a 1 Percent Shock to China’s Industrial Production |
| Chart | Data | 4.10 | China: Slowdown Scenario |
| Chart | Data | 4.11 | Spillovers from China |
| Chart | Data | 4.12 | Transmission of Spillovers through Financial Channels |
| Chart | Data | 4.13 | China: Cyclical Slowdown Scenario |
| Chart | Data | 4.14 | International Migrants and Refugees |
| Chart | Data | 4.15 | Migration by Age and Skill |
| Chart | Data | 4.16 | Determinants of Migration |
| Chart | Data | 4.17 | Females: Low Education versus High Skilled, 2000 |
| Chart | Data | 4.18 | Labor Market Performance |
| Chart | Data | 4.19 | Germany: Present Value of Expected Future Net Fiscal Contribution by Age Group |
| Chart | Data | 4.20 | Estimated Impact of Migration in More Developed Economies, 2100 |
| Chart | Data | 4.21 | Migration: Positive Longer-Term Growth Effects |
| Chart | Data | 4.22 | Contributions of Outward Migration to Population Growth |
| Chart | Data | 4.23 | Migration of Population with Tertiary Education |
| Chart | Data | 4.24 | Remittances and Diasporas |
| Chart | Data | 4.1.1 | China’s Ties with Low-Income and Developing Countries |
| Chart | Data | 4.3.1 | Migration in Sub-Saharan Africa |
| Chart | Data | 4.3.2 | Age and Education of Migrants and Origin Country Population |
| Chart | Data | 4.3.3 | Top Receivers of Remittances in Sub-Saharan Africa, 2013–15 |
| List of Tables Part A (Download PDF) |
|---|
| List of Tables Part B (Download PDF - available on the web only) |
|---|
