

World Economic Outlook
Uneven Growth: Short-and Long Term Factors
April 2015
[$token_name="PublicationDisclaimer"]

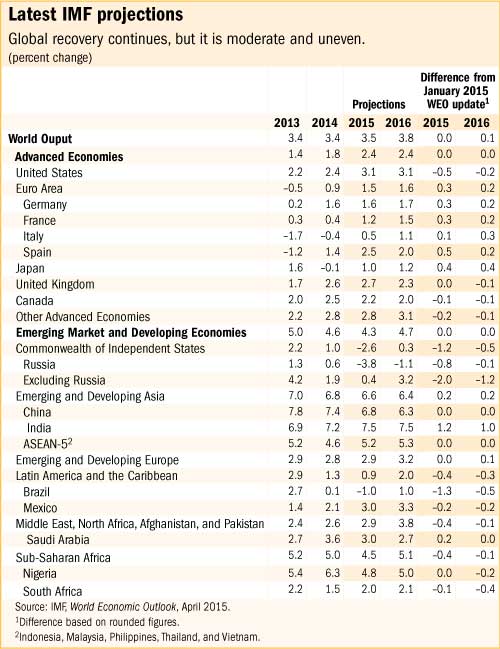
Global growth remains moderate, with uneven prospects across the main countries and regions. It is projected to be 3.5 percent in 2015, in line with forecasts in the January 2015 World Economic Outlook (WEO) Update. Relative to last year, the outlook for advanced economies is improving, while growth in emerging market and developing economies is projected to be lower, primarily reflecting weaker prospects for some large emerging market economies and oil-exporting countries.
Contents
Front Matter
Chapter 1. Recent Developments and Prospects
Global growth in 2014 was a modest 3.4 percent, reflecting a pickup in growth in advanced economies relative to the previous year and a slowdown in emerging market and developing economies. Complex forces that affected global activity in 2014 are still shaping the outlook: medium- and long-term trends, global shocks, and many country- or region-specific factors. Growth is projected to be stronger in 2015 relative to 2014 in advanced economies, but weaker in emerging markets, reflecting more subdued prospects for some large emerging market economies and oil exporters. The chapter discusses recent developments in and prospects for the world economy, explores potential risks (both downside and upside), and makes policy recommendations. A special feature looks at developments in commodity markets, focusing specifically on investment in an era of low oil prices.

- Recent Developments and Prospects
- Risks
- Policies
- Special Feature: Commodity Market Developments and Forecasts, with a Focus on Investment in an Era of Low Oil Prices
- References
| Boxes | |||
| Scen.1 | The Global Impact of Lower Oil Prices | ||
| Scen.2 | Global Implications of Exchange Rate Movements | 1.1 | The Oil Price Collapse: Demand or Supply? |
| 1.2 | Understanding the Role of Cyclical and Structural Factors in the Global Trade Slowdown | ||
| Table | |||
| 1.1 | Overview of the World Economic Outlook Projections | ||
| Figures | |||
| Chart | Data | 1.1 | Global Activity Indicators |
| Chart | Data | 1.2 | Global Inflation |
| Chart | Data | 1.3 | Advanced Economies: Monetary Conditions |
| Chart | Data | 1.4 | Commodity and Oil Markets |
| Chart | Data | 1.5 | Financial Market Conditions in Advanced Economies |
| Chart | Data | 1.6 | Financial Market Conditions and Capital Flows in Emerging Market Economies |
| Chart | Data | 1.7 | Fiscal Policies |
| Chart | Data | 1.8 | Monetary Policies and Credit in Emerging Market Economies |
| Chart | Data | 1.9 | GDP Growth Forecasts |
| Chart | Data | 1.10 | External Sector |
| Chart | Data | 1.11 | Exchange Rates and Reserves |
| Chart | Data | 1.12 | Risks to the Global Outlook |
| Chart | Data | 1.13 | Recession and Deflation Risks |
| Chart | Data | 1.14 | Capacity, Unemployment, and Output Trends |
| Chart | Data | 1.SF.1 | Commodity Price Indices |
| Chart | Data | 1.SF.2 | Oil Supply Growth |
| Chart | Data | 1.SF.3 | Brent Futures Curves |
| Chart | Data | 1.SF.4 | Brent Price Prospects, March 17, 2015 |
| Chart | Data | 1.SF.5 | United States: Weekly Rig Count |
| Chart | Data | 1.SF.6 | Global Oil Investment and Oil Price |
| Chart | Data | 1.SF.7 | Response of Oil Investment to Oil Prices |
| Chart | Data | 1.SF.8 | Response of Oil Production to Oil Investment |
| Chart | Data | 1.SF.9 | OPEC and Non-OPEC Oil Production and Investment |
| Chart | Data | 1.SF.10 | Conventional and Unconventional Oil Production and Investment |
| Chart | Data | 1.SF.11 | Evolution of Break-Even Prices |
| Chart | Data | 1.SF.12 | Oil Production and Operating Costs by Country |
| Chart | Data | Scen. Fig. 1 |
Potential Impact of the Decline in Oil Prices since August 2014 |
| Chart | Data | Scen. Fig. 2 |
Impact of Exchange Rate Shifts since August 2014 | Chart | Data | 1.1.1 | Drivers of Oil Prices: Daily Two-Variable Model, July 2014–January 2015 |
| Chart | Data | 1.1.2 | Drivers of Oil Prices: Daily Two-Variable Model, 1986 and 2008 |
| Chart | Data | 1.1.3 | Drivers of Oil Prices: Quarterly Four-Variable Model |
| Chart | Data | 1.2.1 | Growth in Real GDP and Volume of Imports |
| Chart | Data | 1.2.2 | Cumulative Import Volumes: Data, Model, and Linear Trend |
| Chart | Data | 1.2.3 | Long-Term Elasticity |
| Chart | Data | 1.2.4 | Long-Term Elasticities |
Chapter 2. Country and Regional Perspectives
Global growth is forecast at 3.5 percent in 2015 and 3.8 percent in 2016, with uneven prospects across the main countries and regions of the world. The distribution of risks to near-term global growth has become more balanced relative to the October World Economic Outlook but is still tilted to the downside. The decline in oil prices could boost activity more than expected. Geopolitical tensions continue to pose threats, and risks of disruptive shifts in asset prices remain relevant. In some advanced economies, protracted low inflation or deflation also pose risks to activity. The chapter takes a region-by-region look at the recent development in the world economy and the outlook for 2015, with particular attention to notable development in countries within each region.
- The United States and Canada: A Solid Recovery
- Europe
- Asia and Pacific: Moderating but Still Outperforming Other Regions
- Latin America and the Caribbean: Another Year of Subpar Growth
- Commonwealth of Independent States: Oil Price Slump Worsens Outlook
- The Middle East, North Africa, Afghanistan, and Pakistan: Oil, Conflicts, and Transitions
- Sub-Saharan Africa: Resilience in the Face of Headwinds
- References
| Tables | |||
| 2.1 | Advanced Economies: Real GDP, Consumer Prices, Current Account Balance, and Unemployment | ||
| 2.2 | European Economies: Real GDP, Consumer Prices, Current Account Balance, and Unemployment | ||
| 2.3 | Asian and Pacific Economies: Real GDP, Consumer Prices, Current Account Balance, and Unemployment | ||
| 2.4 | Western Hemisphere Economies: Real GDP, Consumer Prices, Current Account Balance, and Unemployment | ||
| 2.5 | Commonwealth of Independent States Economies: Real GDP, Consumer Prices, Current Account Balance, and Unemployment | ||
| 2.6 | Middle East and North African Economies, Afghanistan, and Pakistan: Real GDP, Consumer Prices, Current Account Balance, and Unemployment | ||
| 2.7 | Sub-Saharan African Economies: Real GDP, Consumer Prices, Current Account Balance, and Unemployment | ||
| Figures | |||
| Chart | Data | 2.1 | 2015 GDP Growth Forecasts and the Effects of an Oil Price Shock |
| Chart | Data | 2.2 | United States and Canada: A Solid Recovery |
| Chart | Data | 2.3 | Advanced Europe: Spillovers from a Stagnant Euro Area |
| Chart | Data | 2.4 | Emerging and Developing Europe: Slower Growth amid Weak External Demand |
| Chart | Data | 2.5 | Asia and Pacific: Moderating but Still Outperforming |
| Chart | Data | 2.6 | Latin America and the Caribbean: Persistent Weakness |
| Chart | Data | 2.7 | Commonwealth of Independent States: Coping with Geopolitical Risks and Lower Oil Prices |
| Chart | Data | 2.8 | Middle East, North Africa, Afghanistan, and Pakistan: Oil, Conflicts, and Transitions |
| Chart | Data | 2.9 | Sub-Saharan Africa: Resilience in the Face of Headwinds |
Chapter 3. Where Are We Headed? Perspectives on Potential Output
This chapter finds that potential output growth across advanced and emerging market economies has declined in recent years. In advanced economies, this decline started as far back as the early 2000s and worsened with the global financial crisis. In emerging market economies, in contrast, it began only after the crisis. The chapter’s analysis suggests that potential output growth in advanced economies is likely to increase slightly from current rates as some crisis-related effects wear off, but to remain below precrisis rates in the medium term. The main reasons are aging populations and the gradual increase in capital growth from current rates as output and investment recover from the crisis. In contrast, in emerging market economies, potential output growth is expected to decline further, owing to aging populations, weaker investment, and lower total factor productivity growth as these economies catch up to the technological frontier.
- Introduction
- Potential Output: A Primer
- Looking Back: How Did Potential Growth Evolve before the Crisis?
- How Did Potential Growth Evolve during the Crisis?
- Where Are We Headed?
- Summary Findings and Policy Implications
- References
| Annexes | |||
| 3.1 | Data Sources and Country Groupings | ||
| 3.2 | Multivariate Filter Methodology | ||
| 3.3 | Estimating Trend Labor Force Participation Rates | ||
| 3.2 | Potential Output in the Aftermath of the Global Financial Crisis | ||
| 3.2 | Human Capital Growth Projections | ||
| Boxes | |||
| 3.1 | Steady As She Goes: Estimating Sustainable Output | ||
| 3.2 | U.S. Total Factor Productivity Spillovers | ||
| 3.3 | Total Factor Productivity Growth in Advanced Economies: A Look into Sectoral Patterns | ||
| 3.4 | The Effects of Financial Crises on Labor Productivity: The Role of Sectoral Reallocation | ||
| 3.5 | The Effects of Structural Reforms on Total Factor Productivity | ||
| Tables | |||
| 3.1.1 | Countries Included in the Analysis | ||
| 3.1.2 | Data Sources | ||
| 3.2.1 | Properties of Adjusted Total Factor Productivity Compared with Solow Residual, Advanced Economies, 1970–2007 | ||
| 3.2.2 | Transmission Channels | ||
| 3.5.1 | Impact of Product and Labor Market Frictions on Total Factor Productivity Growth | ||
| 3.5.2 | Impact of Information and Communications Technology, Human Capital, and Research and Development | ||
| Figures | |||
| Chart | Data | 3.1 | Output Compared to Precrisis Expectations |
| Chart | Data | 3.2 | WEO Medium-Term Growth Projections |
| Chart | Data | 3.3 | Precrisis Potential Output Growth Evolution |
| Chart | Data | 3.4 | Variation in Potential Output Growth across Countries |
| Chart | Data | 3.5 | Determinants of Potential Output Growth in Advanced Economies |
| Chart | Data | 3.6 | Determinants of Potential Output Growth in Emerging Market Economies |
| Chart | Data | 3.7 | Components of Potential Output Growth during the Global Financial Crisis in Advanced Economies |
| Chart | Data | 3.8 | Components of Potential Output Growth during the Global Financial Crisis in Emerging Market Economies |
| Chart | Data | 3.9 | Effect of Demographics on Employment Growth |
| Chart | Data | 3.10 | Investment-to-Capital Ratio |
| Chart | Data | 3.11 | Future Evolution of Potential Output Growth and Its Components |
| Chart | Data | Annex 3.2.1 |
Potential Output Growth |
| Chart | Data | Annex 3.3.1 |
Population Share Distributions by Age |
| Chart | Data | Annex 3.4.1 |
Aftermath of the Global Financial Crisis in Advanced Economies |
| Chart | Data | Annex 3.4.2 |
Aftermath of the Global Financial Crisis in Emerging Market Economies |
| Chart | Data | Annex 3.5.1 |
Human Capital Growth Projections |
| Chart | Data | 3.1.1 | Output Gap in Selected Euro Area Economies: Multivariate Filter Augmented with Financial Variables versus That with Inflation Only |
| Chart | Data | 3.1.2 | Credit and Output Gaps Implied by the Dynamic Stochastic General Equilibrium Model |
| Chart | Data | 3.2.1 | U.S. Total Factor Productivity Spillovers to Other Advanced Economies |
| Chart | Data | 3.3.1 | Employment and Value Added, 1980–2007 |
| Chart | Data | 3.3.2 | Selected Country Groups: Total Factor Productivity Growth in Goods and Services Sectors |
| Chart | Data | 3.3.3 | Information and Communications Technology Productivity Growth and Spillovers |
| Chart | Data | 3.4.1 | Response of Labor Productivity to Crises |
| Chart | Data | 3.5.1 | Short- and Medium-Term Impact of Structural Reforms on Total Factor Productivity Growth |
Chapter 4. Private Investment: What’s the Holdup?
Private fixed investment in advanced economies contracted sharply during the global financial crisis, and there has been little recovery since. Investment has generally slowed more gradually in the rest of the world. Although housing investment fell especially sharply during the crisis, business investment accounts for the bulk of the slump, and the overriding factor holding it back has been the overall weakness of economic activity. In some countries, other contributing factors include financial constraints and policy uncertainty. These findings suggest that addressing the general weakness in economic activity is crucial for restoring growth in private investment.
- Is There a Global Slump in Private Investment?
- Is the Slump in Private Investment Due to Housing or Is It Broader?
- How Much of the Slump in Business Investment Reflects Weak Economic Activity?
- Which Firms Have Cut Back More on Investment? The Roles of Financial Constraints and Policy Uncertainty
- Have Firms’ Investment Decisions Become Disconnected from Profitability and Financial Market Valuations?
- Policy Implications
- References
| Annexes | |||
| 4.1 | Aggregate Data | ||
| 4.2 | Firm-Level Data | ||
| 4.3 | Instrumental Variables Estimation | ||
| 4.4 | Local Projection Methods | ||
| 4.5 | Accelerator Model Estimation Results | ||
| Box | |||
| 4.1 | After the Boom: Private Investment in Emerging Market and Developing Economies | ||
| Tables | |||
| 4.1 | Firm-Level Evidence: Financial Constraint Channel | ||
| 4.2 | Firm-Level Evidence: Policy Uncertainty Channel | ||
| 4.3 | Investment, Tobin’s Q, Profits, and Cash | ||
| 4.1.1 | Data Sources | ||
| 4.2.1 | Aggregate Firm-Level Investment versus National Investment | ||
| 4.3.1 | Investment-Output Relationship: Instrumental Variables Estimation | ||
| 4.5.1 | Baseline Accelerator Model | ||
| 4.5.2 | Accelerator Model: In-Sample versus Out-of-Sample Estimates | ||
| 4.5.3 | Selected Euro Area Economies: Baseline and Augmented Accelerator Model—Equalized Sample | ||
| Figures | |||
| Chart | Data | 4.1 | Real Private Investment |
| Chart | Data | 4.2 | Real Private Investment, 2008–14 |
| Chart | Data | 4.3 | Categories of Real Fixed Investment |
| Chart | Data | 4.4 | Decomposition of the Investment Slump, 2008–14 |
| Chart | Data | 4.5 | Shares and Relative Prices of Investment Categories |
| Chart | Data | 4.6 | Real Business Investment and Output Relative to Forecasts: Historical Recessions versus Global Financial Crisis |
| Chart | Data | 4.7 | Real Business Investment: Actual and Predicted Based on Weak Economic Activity |
| Chart | Data | 4.8 | Accelerator Model: Real Business Investment |
| Chart | Data | 4.9 | Real Business Investment: Accelerator Model Residuals and Investment Losses Relative to Precrisis Forecasts, 2008–14 |
| Chart | Data | 4.10 | Selected Euro Area Economies: Accelerator Model—Role of Financial Constraints and Policy Uncertainty |
| Chart | Data | 4.11 | Firm Survey Responses: Factors Limiting Production |
| Chart | Data | 4.12 | Firm Investment since the Crisis, by Firm Type |
| Chart | Data | 4.13 | Tobin’s Q and Real Business-Investment-to-Capital Ratios |
| Chart | Data | 4.14 | Investment: Actual and Predicted Based on Tobin’s Q |
| Chart | Data | Annex 4.3.1 |
Actual versus Predicted Real Business Investment—Robustness |
| Chart | Data | Annex 4.5.1 |
Accelerator Model: In Sample versus Out of Sample |
| Chart | Data | Annex 4.5.2 |
Accelerator Model: Controlling for the User Cost of Capital |
| Chart | Data | 4.1.1 | Real Private Fixed Investment |
| Chart | Data | 4.1.2 | Private Investment and Output Forecast Errors: Historical versus Post-2011 Slowdown |
| Chart | Data | 4.1.3 | Contributors to the Private Investment Slowdown since 2011 |
Statistical Appendix
- Assumptions
- What's New
- Data and Conventions
- Classification of Countries
- General Features and Composition of Groups in the World Economic Outlook Classification
- Table A. Classification by World Economic Outlook Groups and Their Shares in Aggregate GDP, Exports of Goods and Services, and Population, 2014
- Table B. Advanced Economies by Subgroup
- Table C. European Union
- Table D. Emerging Market and Developing Economies by Region and Main Source of Export Earnings
- Table E. Emerging Market and Developing Economies by Region, Net External Position, Status as Heavily Indebted Poor Countries, and Low-Income Developing Countries
- Table F. Economies with Exceptional Reporting Periods
- Table G. Key Data Documentation
- Box A1. Economic Policy Assumptions Underlying the Projections for Selected Economies
| List of Tables Part A (Download PDF) | |||
| A1. | Summary of World Output | ||
| A2. | Advanced Economies: Real GDP and Total Domestic Demand | ||
| A3. | Advanced Economies: Components of Real GDP | ||
| A4. | Emerging Market and Developing Economies: Real GDP | ||
| A5. | Summary of Inflation | ||
| A6. | Advanced Economies: Consumer Prices | ||
| A7. | Emerging Market and Developing Economies: Consumer Prices | ||
| A8. | Major Advanced Economies: General Government Fiscal Balances and Debt | ||
| A9. | Summary of World Trade Volumes and Prices | ||
| A10. | Summary of Current Account Balances | ||
| A11. | Advanced Economies: Balance on Current Account | ||
| A12. | Emerging Market and Developing Economies: Balance on Current Account | ||
| A13. | Summary of Financial Account Balances | ||
| A14. | Summary of Net Lending and Borrowing | ||
| A15. | Summary of World Medium-Term Baseline Scenario | ||
| List of Tables Part B (Download PDF) | |||
| B1. | Advanced Economies: Unemployment, Employment, and Real GDP per Capita | ||
| B2. | Emerging Market and Developing Economies: Real GDP | ||
| B3. | Advanced Economies: Hourly Earnings, Productivity, and Unit Labor Costs in Manufacturing | ||
| B4. | Emerging Market and Developing Economies: Consumer Prices | ||
| B5. | Summary of Fiscal and Financial Indicators | ||
| B6. | Advanced Economies: General and Central Government Net Lending/Borrowing and Excluding Social Security Schemes | ||
| B7. | Advanced Economies: General Government Structural Balances | ||
| B8. | Emerging Market and Developing Economies: General Government Net Lending/ Borrowing and Overall Fiscal Balance | ||
| B9. | Emerging Market and Developing Economies: General Government Net Lending/ Borrowing | ||
| B10. | Advanced Economies: Exchange Rates | ||
| B11. | Emerging Market and Developing Economies: Broad Money Aggregates | ||
| B12. | Advanced Economies: Export Volumes, Import Volumes, and Terms of Trade in Goods and Services | ||
| B13. | Emerging Market and Developing Economies by Region: Total Trade in Goods | ||
| B14. | Emerging Market and Developing Economies by Source of Export Earnings: Total Trade in Goods | ||
| B15. | Summary of Current Account Transactions | ||
| B16. | Summary of External Debt and Debt Service | ||
| B17. | Emerging Market and Developing Economies by Region: External Debt by Maturity | ||
| B18. | Emerging Market and Developing Economies by Analytical Criteria: External Debt by Maturity | ||
| B19. | Emerging Market and Developing Economies: Ratio of External Debt to GDP | ||
| B20. | Emerging Market and Developing Economies: Debt-Service Ratios | ||
| B21. | Emerging Market and Developing Economies, Medium-Term Baseline Scenario: Selected Economic Indicators | ||
| World Economic Outlook, Selected Topics | |||
| IMF Executive Board Discussion of the Outlook, April 2015 | |||